Simulation
The Simulation workspace (Ctrl+3) sets up and runs analyses of the active cell’s
schematic and shows the results.
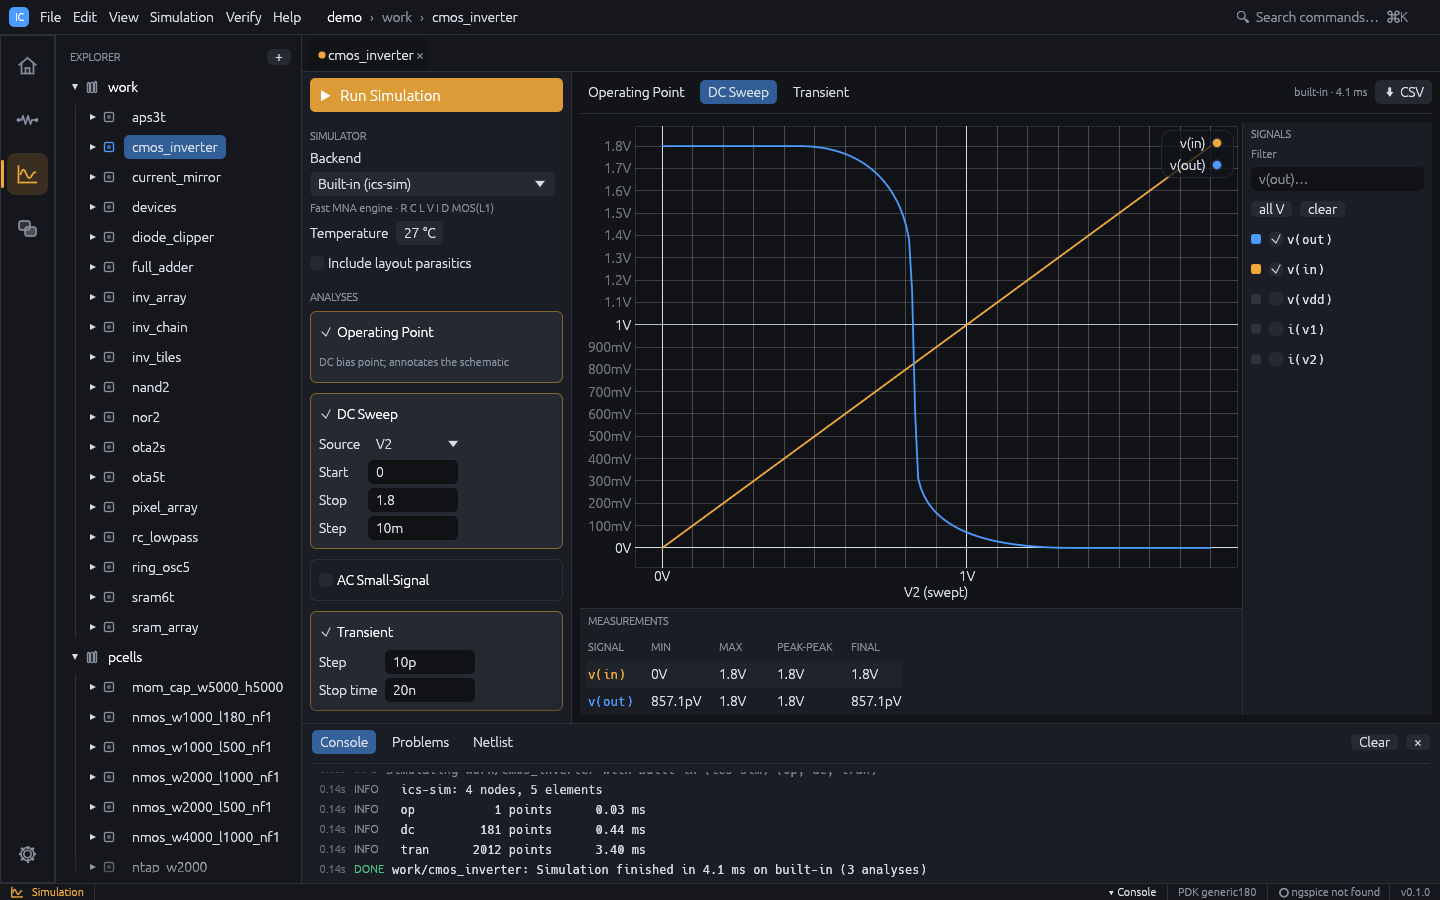
Running a simulation
- Open a cell with a schematic and switch to the Simulation workspace.
- In Analyses, tick the analyses to run and fill in their fields.
- Press Run Simulation,
F5orCtrl+Enter(also Simulation > Run or Simulate in the schematic toolbar).
Simulation runs in the background. Starting it from another workspace switches to the Simulation workspace. Errors appear in a red Simulation error box and in the console.
Setup panel
Simulator
| Field | Meaning |
|---|---|
| Backend | Built-in (ics-sim) (default) or ngspice |
| Corner | Model corner of the PDK model library; shown only when the technology’s models have corners (default: the library’s default corner) |
| Temperature | -55 to 200 °C, default 27 (written as .temp) |
| Include layout parasitics | Add parasitics extracted from the cell’s layout (see below); disabled when the cell has no layout |
The line under the backend shows whether ngspice was found, or that PDK models need ngspice when the technology has a model library. Set the ngspice path in Settings (see Installation).
Analyses
| Analysis | Fields (defaults) | Notes |
|---|---|---|
| Operating Point | none (on by default) | Annotates the schematic |
| DC Sweep | Source, Start 0, Stop 1.8, Step 10m | Source is any V or I source in the schematic |
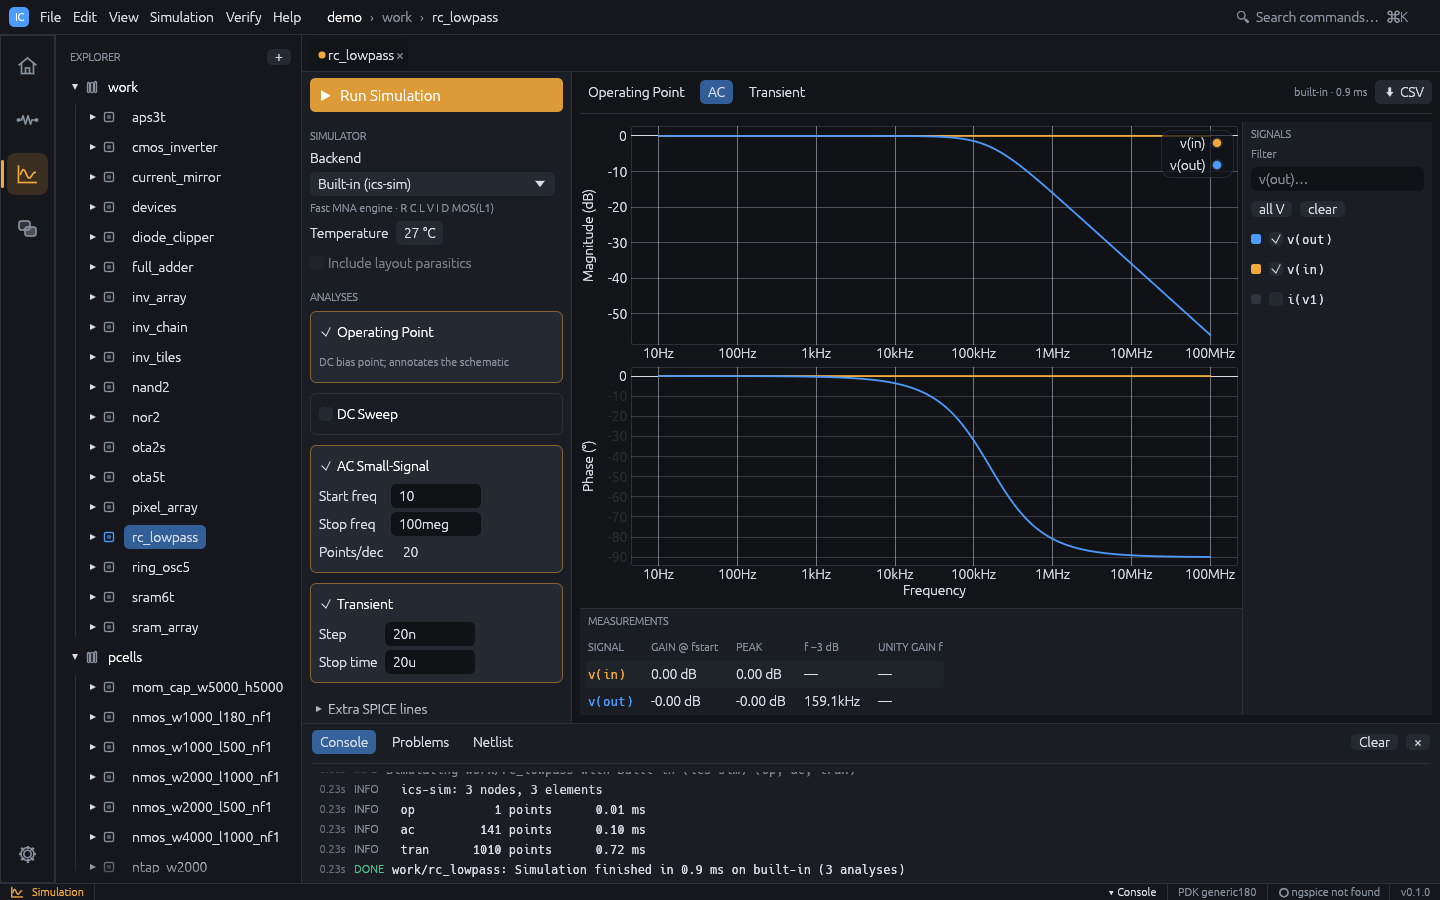
| AC Small-Signal | Start freq 1, Stop freq 10g, Points/dec 20 | Decade sweep; give a source an AC magnitude |
| Transient | Step 10p, Stop time 20n | Give a source a Transient waveform |
Fields with an invalid value turn red; validation messages appear under the card.
Extra SPICE lines
Lines in this collapsible section are appended verbatim to the deck before the analyses,
for example .options reltol=1e-4. Show netlist displays the generated deck next to the
results.
The setup (backend, corner, analyses, temperature, parasitics flag, extra lines and the
sweep setup) is saved per cell in sim.json.
Results
Each analysis has its own tab: Operating Point, DC Sweep, AC, Transient.
The tab bar shows the backend and run time, and CSV exports the current dataset (AC
values as name_re / name_im columns).
Waveforms
- Signals (right): tick signals to plot. Filter narrows the list, all V selects
every node voltage, clear clears the selection. By default
v(out),v(in),v(vout)andv(vin)are shown when present, otherwise the first three voltages. The selection is kept per analysis between runs. Waveforms plotted from the Waveform Calculator appear here as signals named after their expression. - Compare runs (above the signal list): the earlier runs of the cell. Tick one to draw its signals dashed on the same plot and list them in the measurements (see Results Browser).
- Plot: DC and transient results share one plot. AC results are a Bode pair: Magnitude (dB) over Phase (°) on a logarithmic frequency axis, with linked zoom and cursor. Hover a trace to read values. Scroll to zoom, drag to pan, double-click to reset.
- Measurements (bottom), one row per plotted signal:
- DC and transient: MIN, MAX, PEAK-PEAK, FINAL.
- AC: GAIN @ fstart, PEAK, f -3 dB, UNITY GAIN f.
Operating point
The Operating Point tab lists node voltages and branch currents, and per device:
- MOS: region (cutoff, saturation, triode),
id,vgs,vds,vth,gm,gds - diode:
vd,id,gd - resistor:
v,i,p
Device details come from the built-in engine only. The node voltages are also drawn on the schematic (see Schematic).
Example: transient of the RC low-pass
- Run
ic-studio --demo --cell rc_lowpass --workspace simulation. - The cell has Operating Point, AC and Transient set up. Press
F5. - Open the AC tab: the f -3 dB column shows about 159 kHz for
v(out). - Open the Transient tab to see the input pulse and the filtered output.
- To change the input, go to the schematic (
Ctrl+2), select the source, edit Transient, and pressF5again.
Measurements, corners and Monte Carlo
- Tools > Waveform Calculator evaluates expressions on the results, such as
bandwidth(v(out)/v(in)),risetime(v(out))orphasemargin(v(out)), and plots derived waveforms. See Waveform Calculator. - Tools > Corner / Sweep Manager runs the setup over model corners, temperatures and parameter values, and Monte Carlo variations, in parallel; specs with limits are checked on every point, with statistics, yield, overlaid waveforms and an HTML datasheet. See Corner / Sweep Manager.
- Tools > Results Browser keeps earlier runs for comparison, for example the schematic against the post-layout simulation.
Post-layout simulation
When Include layout parasitics is ticked and the cell has a layout, IC Studio extracts the layout, matches its nets to the schematic through LVS and adds to the deck:
- wire capacitance to substrate (
Cpar_*), - lateral and overlap coupling capacitance between nets (
Cc_*), - MOS drain / source junction sizes (
ad as pd ps) from the drawn diffusion, - an RC network of wire, via and gate resistance (
Rpar_*), with each MOS terminal moved to the nearest node of its net.
Coupling to a layout net with no schematic counterpart is lumped to ground. The console
shows a one-line summary. For a useful result, the layout should be LVS clean (see
Verification). From the command line: ics sim <project> <cell> --parasitics.
Backends
Built-in engine
A modified nodal analysis engine written in Rust. It supports:
- elements
R C L V I D M(no subcircuits or behavioural sources), - sources:
DC,AC mag [phase],PULSE(v1 v2 td tr tf pw per),SIN(vo va freq td theta),PWL(t v ...), - directives
.model,.op,.dc,.ac,.tran,.temp,.end; other dot lines such as.options,.paramand.subcktare ignored, and a deck with.includeor.libis rejected (model libraries need ngspice), - diode model (
is,n,cjo) and MOS level 1 (vto,kp,lambda,gamma,phi,tox,cgso,cgdo,cj,cjsw) with instance parametersw l m ad as pd ps.
The generic nmos / pmos models the netlister writes use vto = ±0.45 and
kp = 280u / 70u; a MOS model parameter left out defaults to vto = ±0.7, kp = 2e-5.
ngspice
With the ngspice backend, IC Studio runs ngspice in batch mode and reads its raw output.
ngspice reads the deck itself, so subcircuit devices (X), .include and .lib model
libraries of a PDK work; IC Studio only takes the analyses (.op, .dc, .ac, .tran)
from the deck when the setup lists none.