RCWA/FDTD 수렴 분석 리포트
생성일: 2026-05-07. 로컬 outputs/ 벤치마크 산출물에서 생성됨.
이 페이지는 Python 레벨 벤치마크 결과를 GitHub Pages에서 볼 수 있는 리포트 형태로 정리한다. 큰 원본 산출물은 outputs/에 두고, 선별된 그림과 표만 docs/public/reports/convergence/로 복사한다.
읽는 방법
- COMPASS를 평가하는 사용자라면 요약, 수렴 표, 해석 기준을 먼저 보면 된다. 어떤 수치를 신뢰해도 되는지, 어떤 결과가 아직 시각적 proxy인지 구분한다.
- 솔버 코드를 유지보수하는 경우에는 검증 사다리와 재생성 명령을 내부 체크리스트로 사용한다. 1D 물리 검증, 2D trench 정합성, full-pixel 시각 검증을 섞지 않는 것이 목적이다.
요약 판단
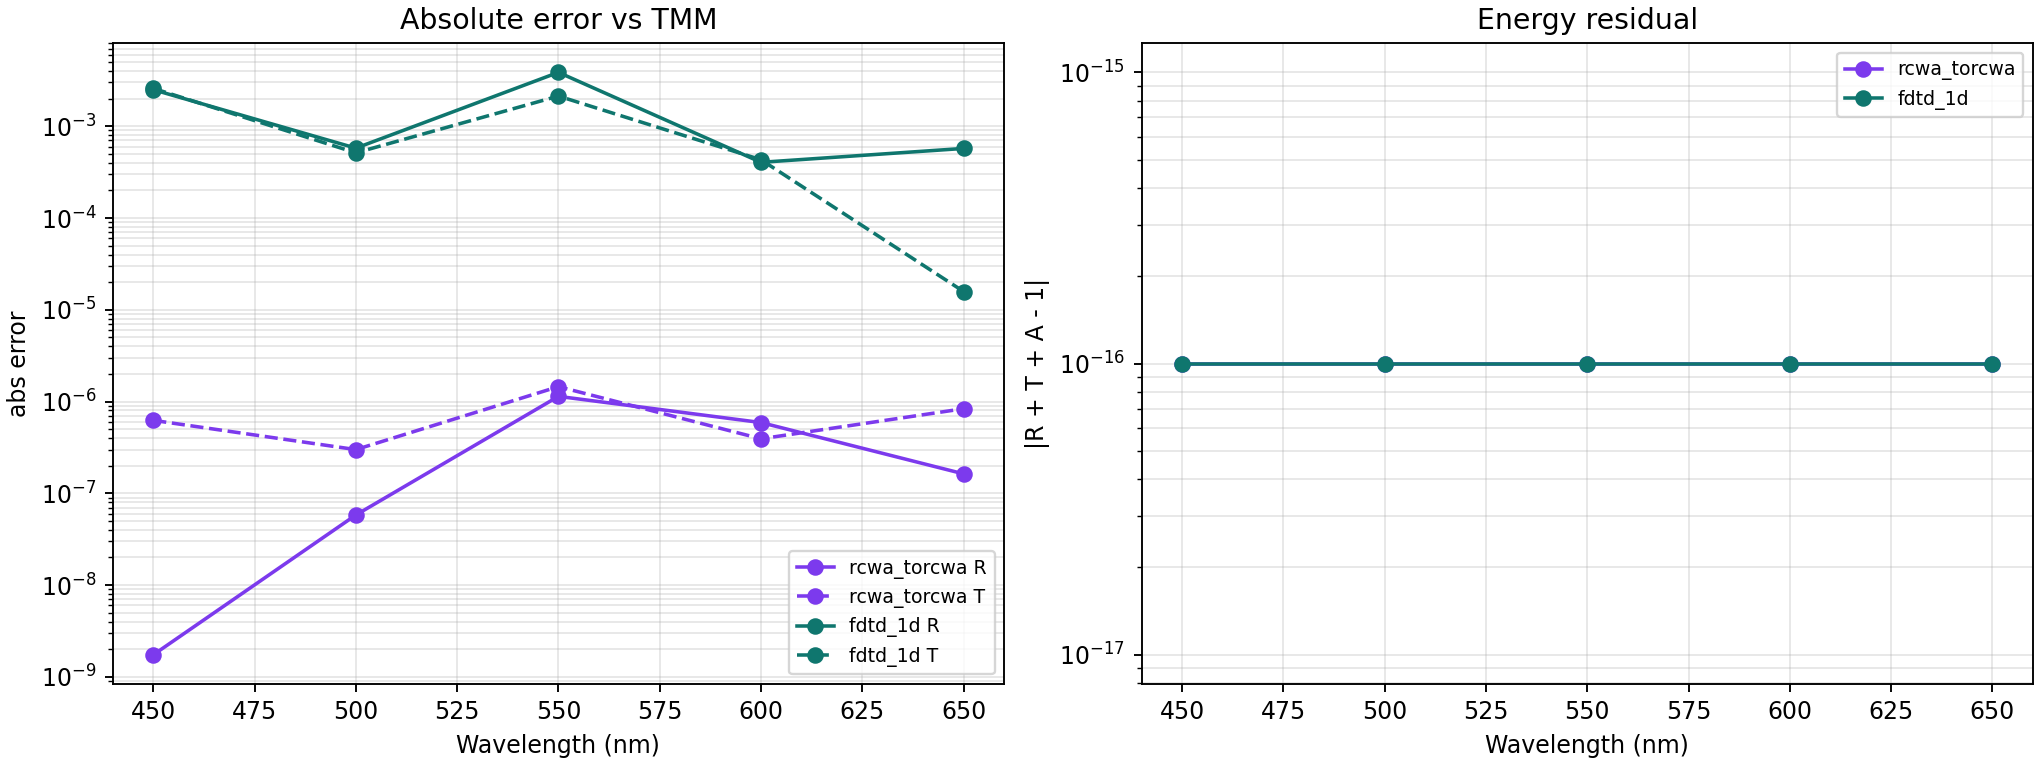
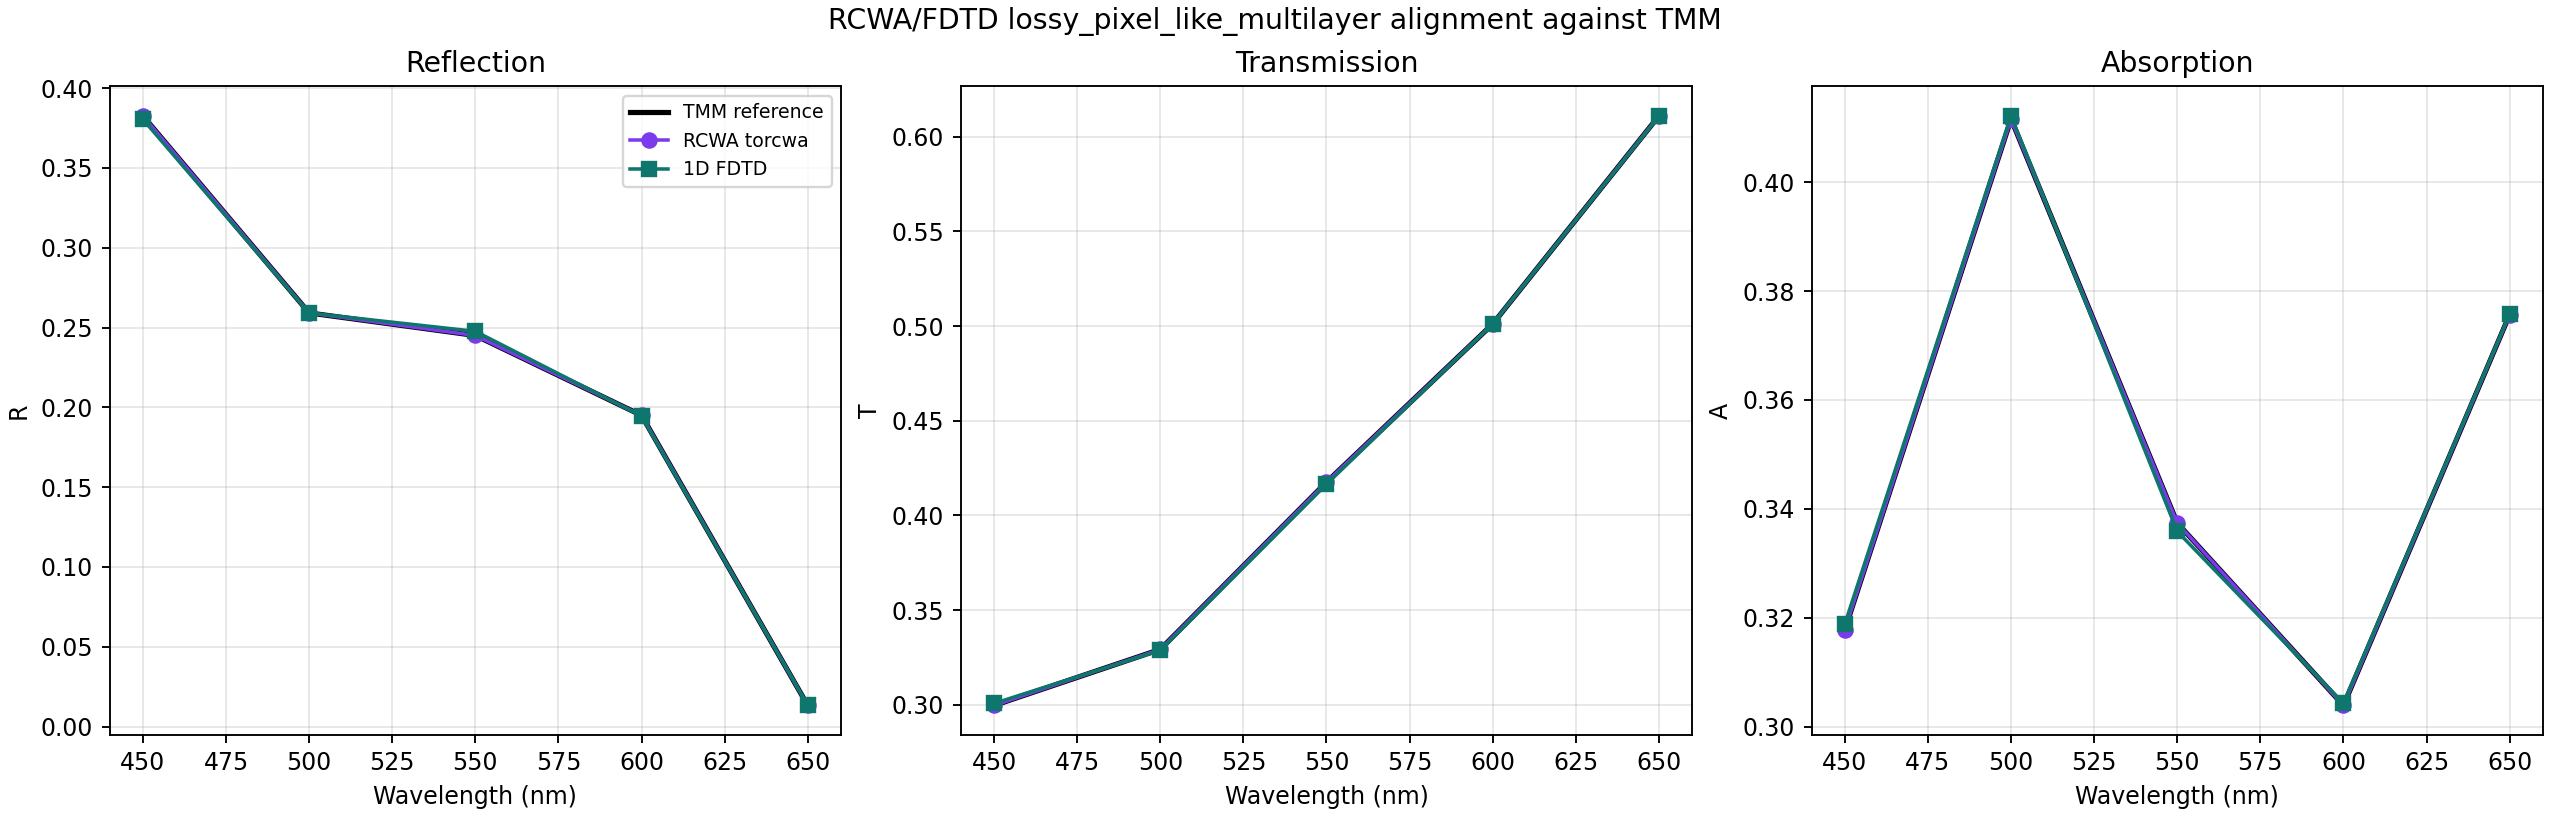
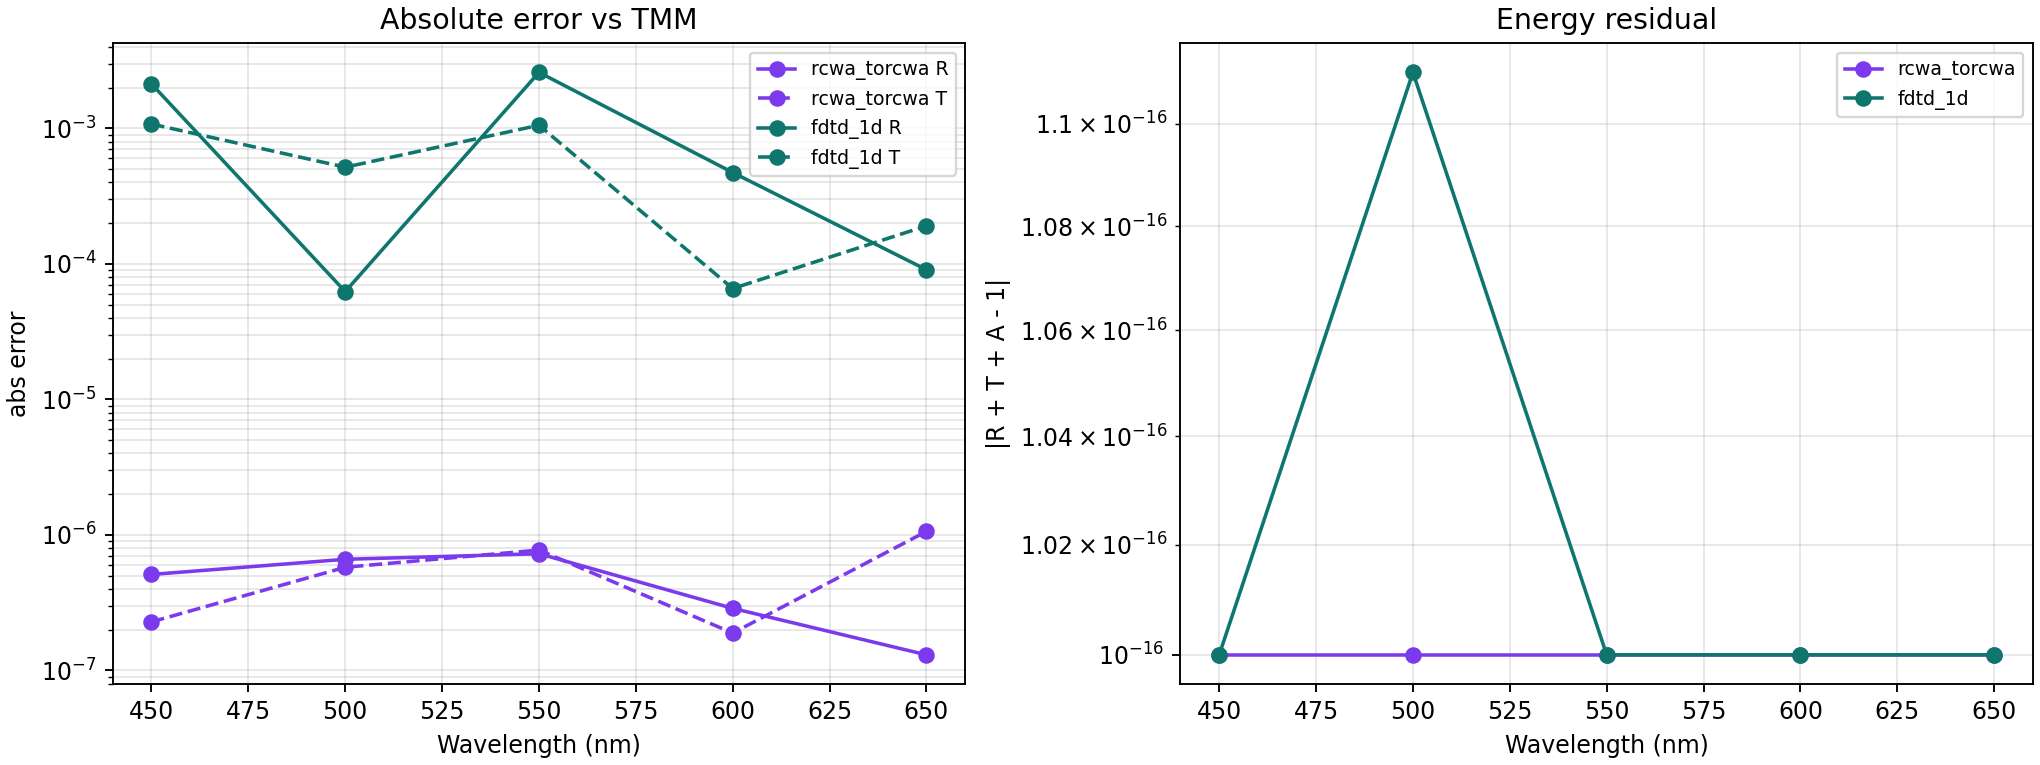
- 1D 정합성 사다리는 통과했다. torcwa RCWA는 TMM과 수치 오차 수준으로 맞고, 1D FDTD도 lossy pixel-like multilayer에서 sub-percent 범위다.
- 2D periodic trench는 현재 coarse 설정에서 FDTI/BDTI 모두 R/T/A 차이가 대략 3 percentage point 이하로 맞는다.
- 전체 2x2 pixel scalar FDTD는 아직 최종 물리 결과가 아니라 시각적 수렴 테스트다. 현재 안정적으로 볼 기준점은 44x44x118, 3500 steps이고, 64x64x170 및 128x128x340 결과는 더 긴 물리 시간이 필요하다.
고해상도 FDTD 행 해석 주의
--fdtd-steps를 고정하면 격자가 촘촘해질수록 실제 물리 시간이 짧아진다. 고해상도 행은 grid 크기만 보지 말고 c*time과 energy tail 값을 함께 봐야 한다.
내부 검증 프로토콜
리포트는 의도적으로 세 단계로 나뉜다. 1D 사다리에서 잡아야 할 normalization 문제를 full pixel proxy로 디버깅하지 않는 것이 중요하다.
- 1D 정합성: analytic TMM 기준으로 material loss, source normalization, monitor 계산, energy accounting을 검증한다.
- 2D periodic trench 정합성: 공유 periodic 구조에서 FDTI/BDTI 방향, boundary condition, R/T/A 정의가 맞는지 확인한다.
- Full-pixel 시각 수렴: 실제 stack 구성, photodiode window, crosstalk proxy를 검증한다. energy tail이 목표 기준 이하가 되기 전까지는 시각적/진단용 벤치마크로 해석한다.
재생성 명령
uv run python scripts\rcwa_fdtd_alignment.py --structure lossy-multilayer --outdir outputs\rcwa_fdtd_alignment_lossy
uv run python scripts\rcwa_fdtd_trench_benchmark.py --convergence --outdir outputs\rcwa_fdtd_trench_benchmark
uv run python scripts\rcwa_fdtd_pixel_benchmark.py --fdtd-steps 3500 --outdir outputs\rcwa_fdtd_pixel_benchmark_steps3500
uv run python scripts\generate_convergence_report.py
고해상도 pixel 체크는 다음 명령으로 다시 만들 수 있다.
uv run python scripts\rcwa_fdtd_pixel_benchmark.py --nx 64 --ny 64 --nz 170 --fdtd-steps 5200 --outdir outputs\rcwa_fdtd_pixel_benchmark_64x64x170_steps5200
uv run python scripts\rcwa_fdtd_pixel_benchmark.py --nx 128 --ny 128 --nz 340 --source-set single --fdtd-steps 10400 --outdir outputs\rcwa_fdtd_pixel_benchmark_128x128x340_single_steps10400
uv run python scripts\generate_convergence_report.py
1D 솔버 정합성 사다리
| 구조 | RCWA 통과 | FDTD 통과 | max |Rrcwa-Rtmm| | max |Rfdtd-Rtmm| | max |Tfdtd-Ttmm| |
|---|---|---|---|---|---|
| lossless_slab | yes | yes | 1.57e-08 | 0.0002 | 0.004 |
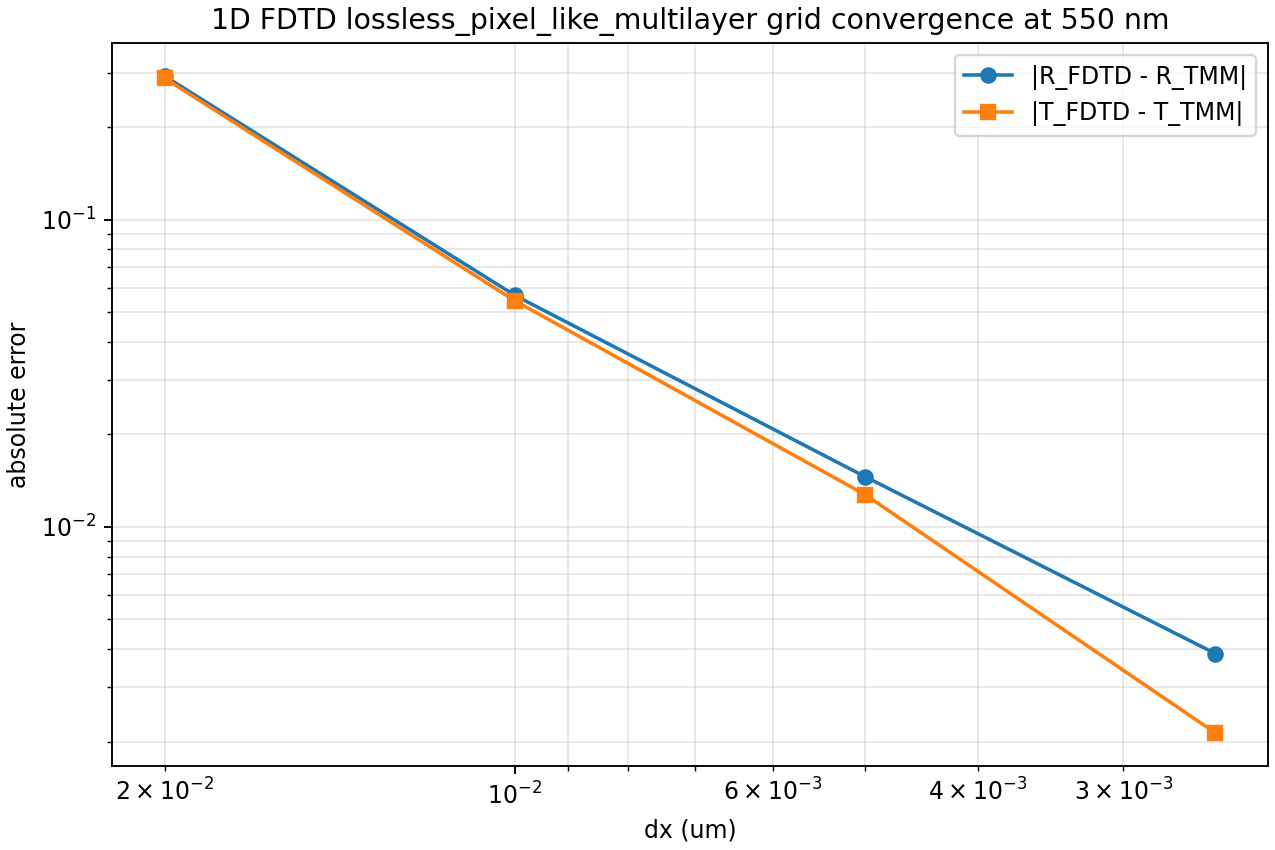
| lossless_pixel_like_multilayer | yes | yes | 1.14e-06 | 0.0039 | 0.0026 |
| lossy_pixel_like_multilayer | yes | yes | 7.26e-07 | 0.0026 | 0.0011 |
1D slab: TMM vs torcwa RCWA vs 1D FDTD
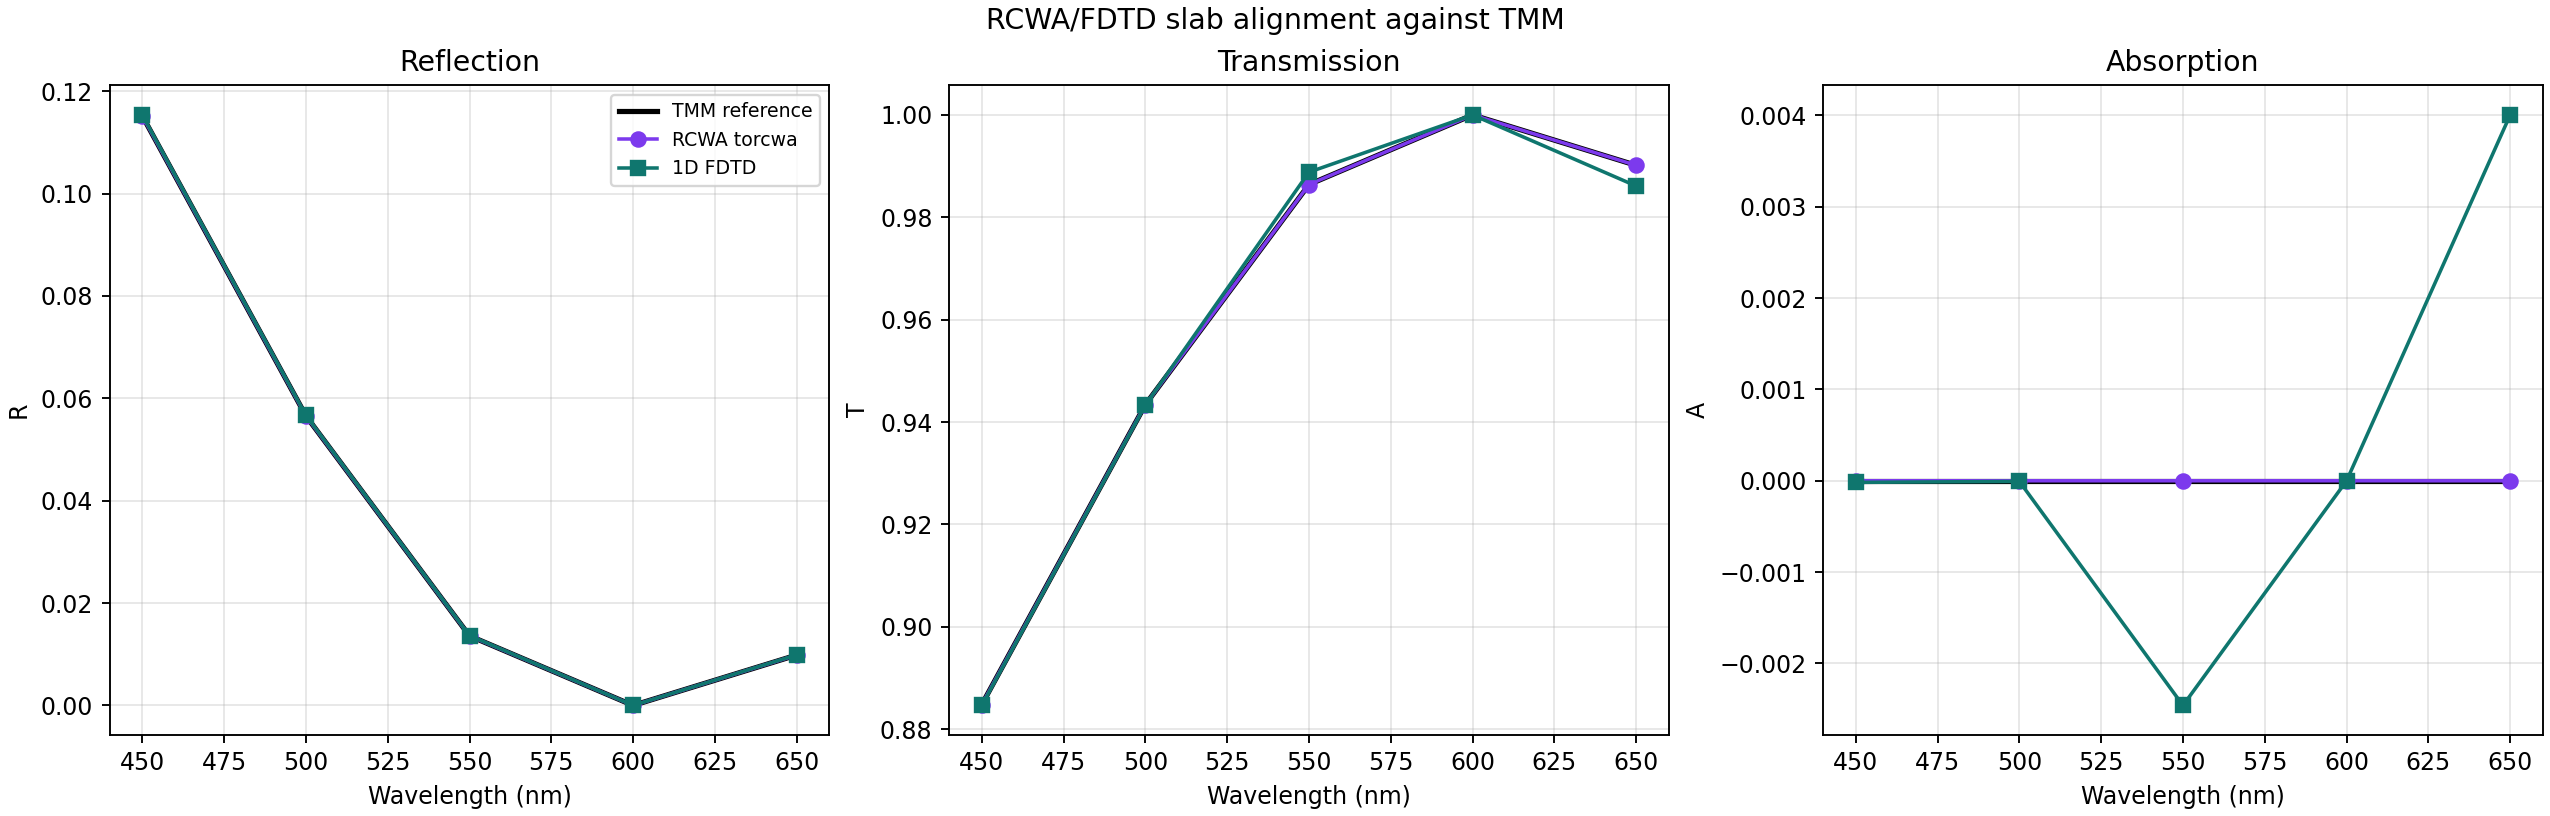
01 Slab Spectrum Alignment
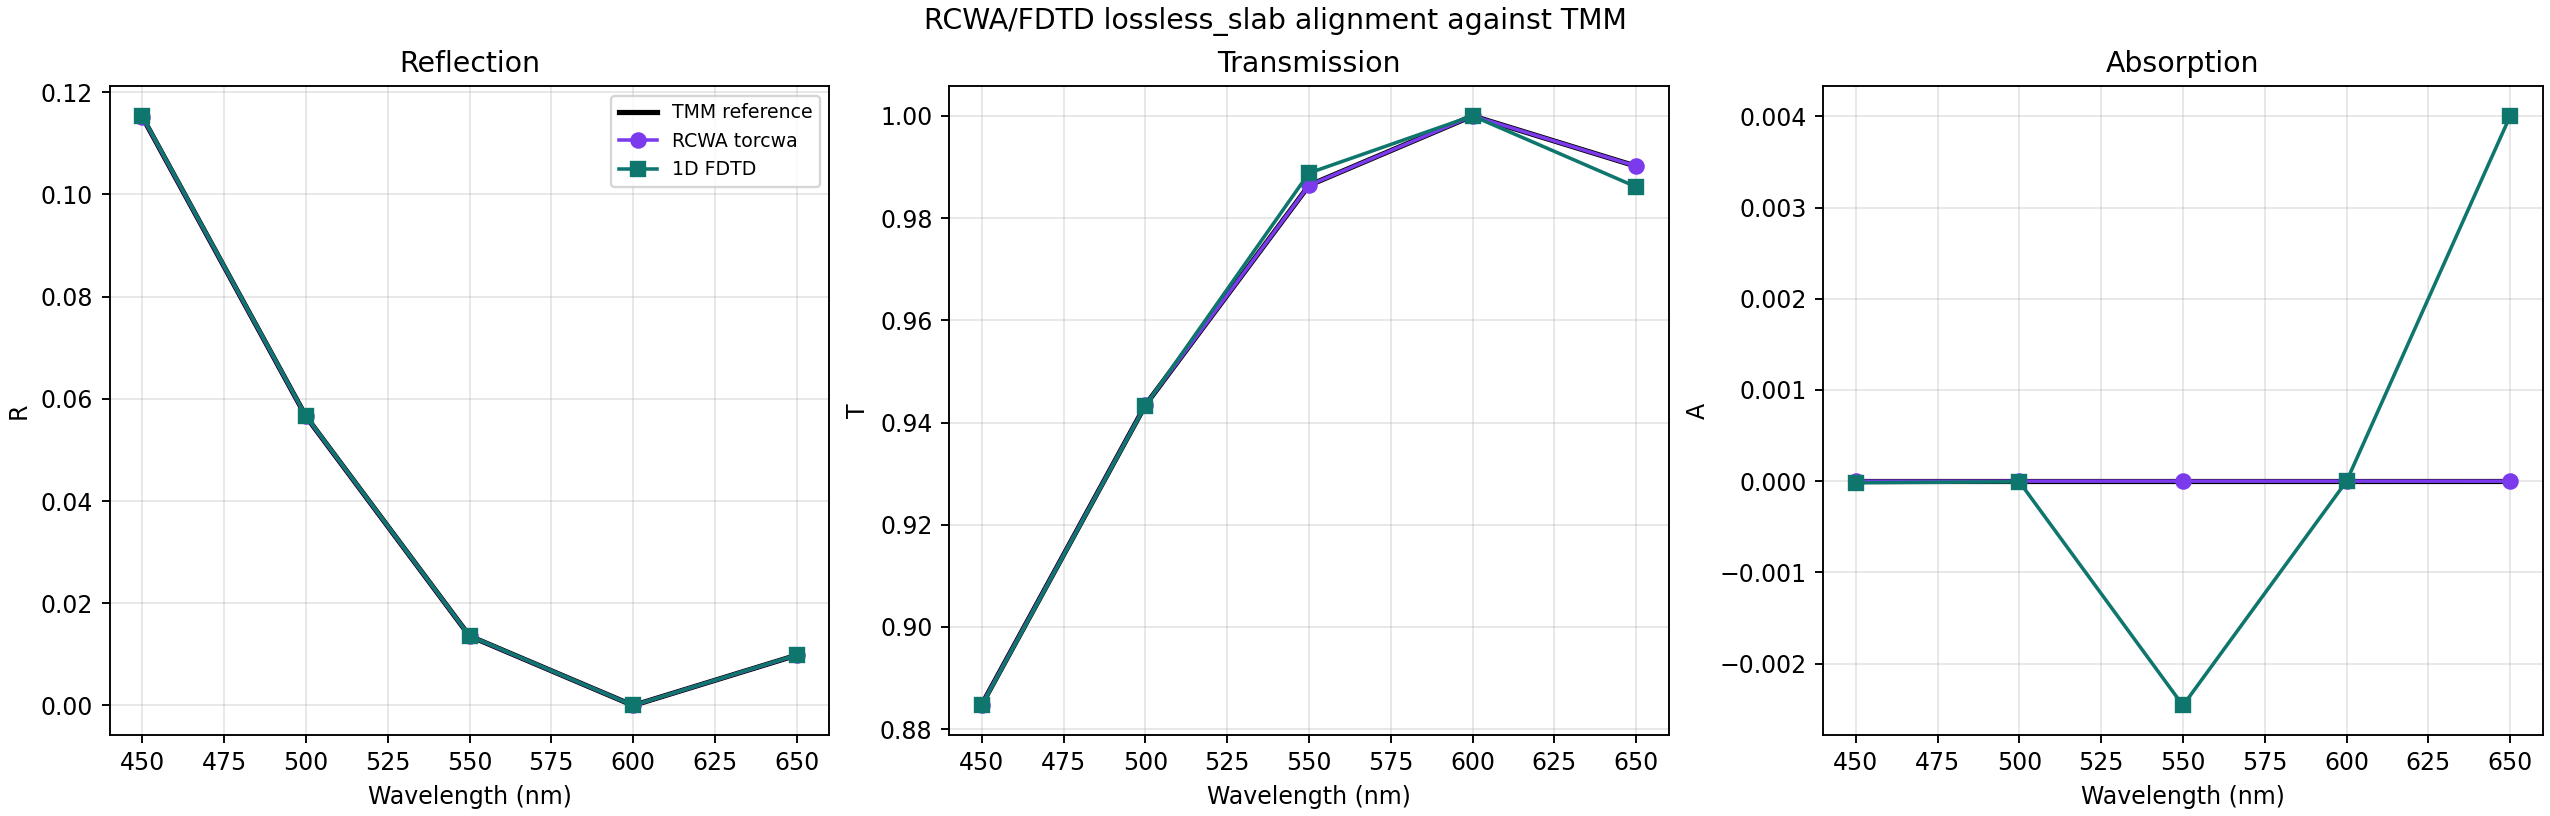
01 Spectrum Alignment
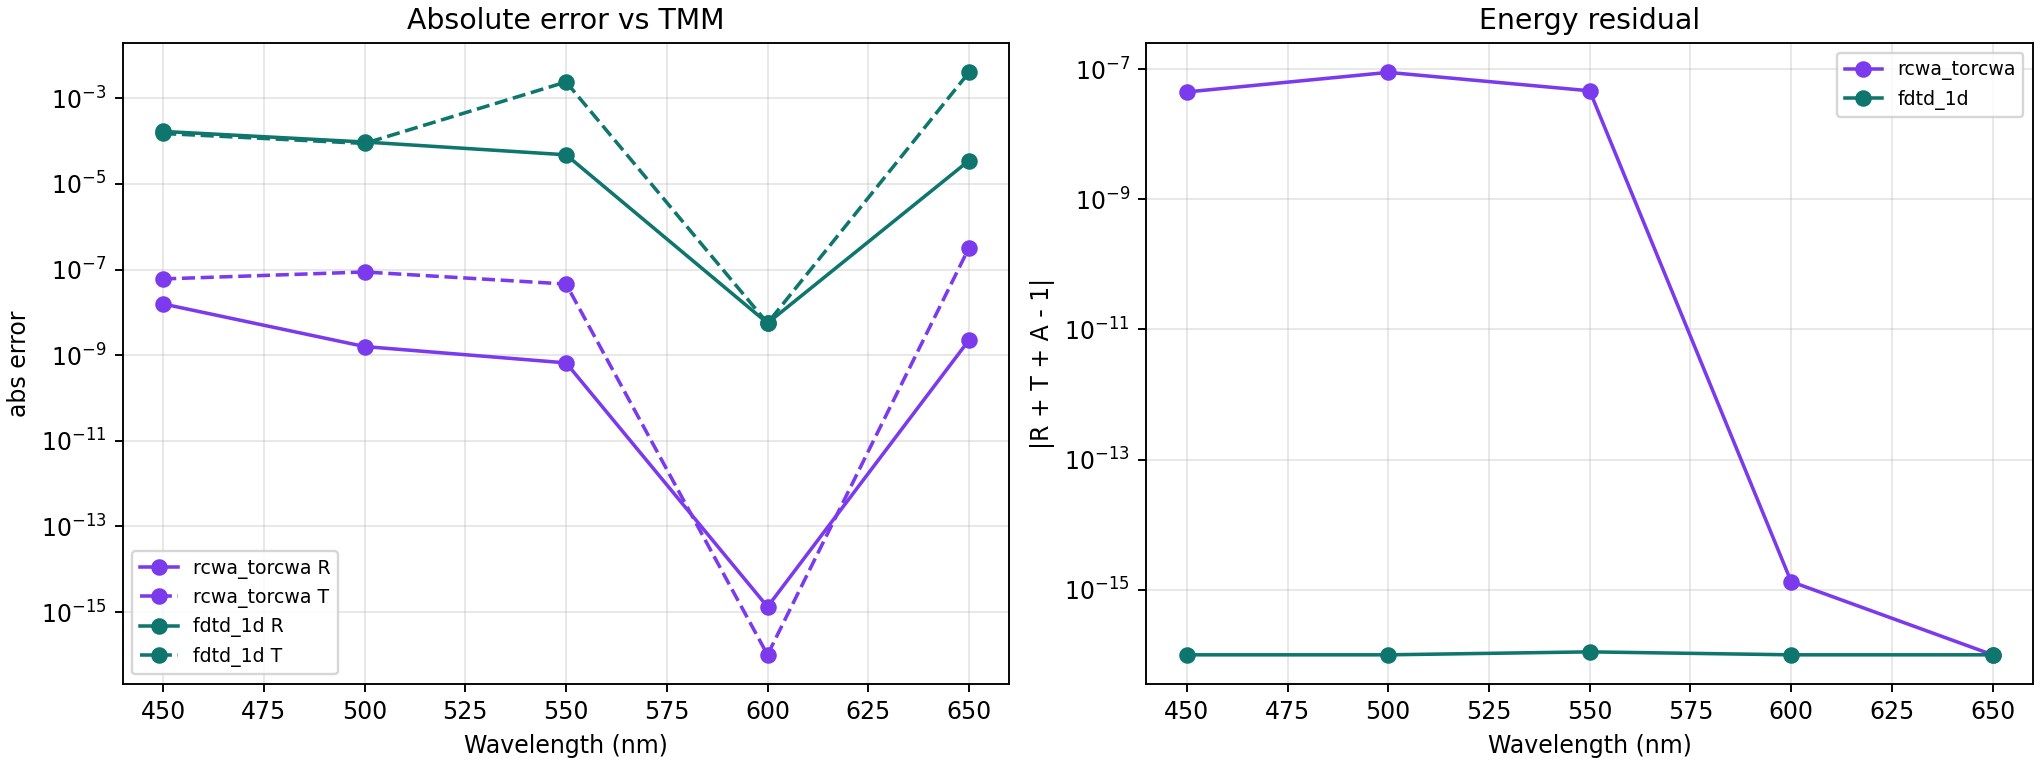
02 Alignment Errors
1D lossless multilayer: TMM vs torcwa RCWA vs 1D FDTD
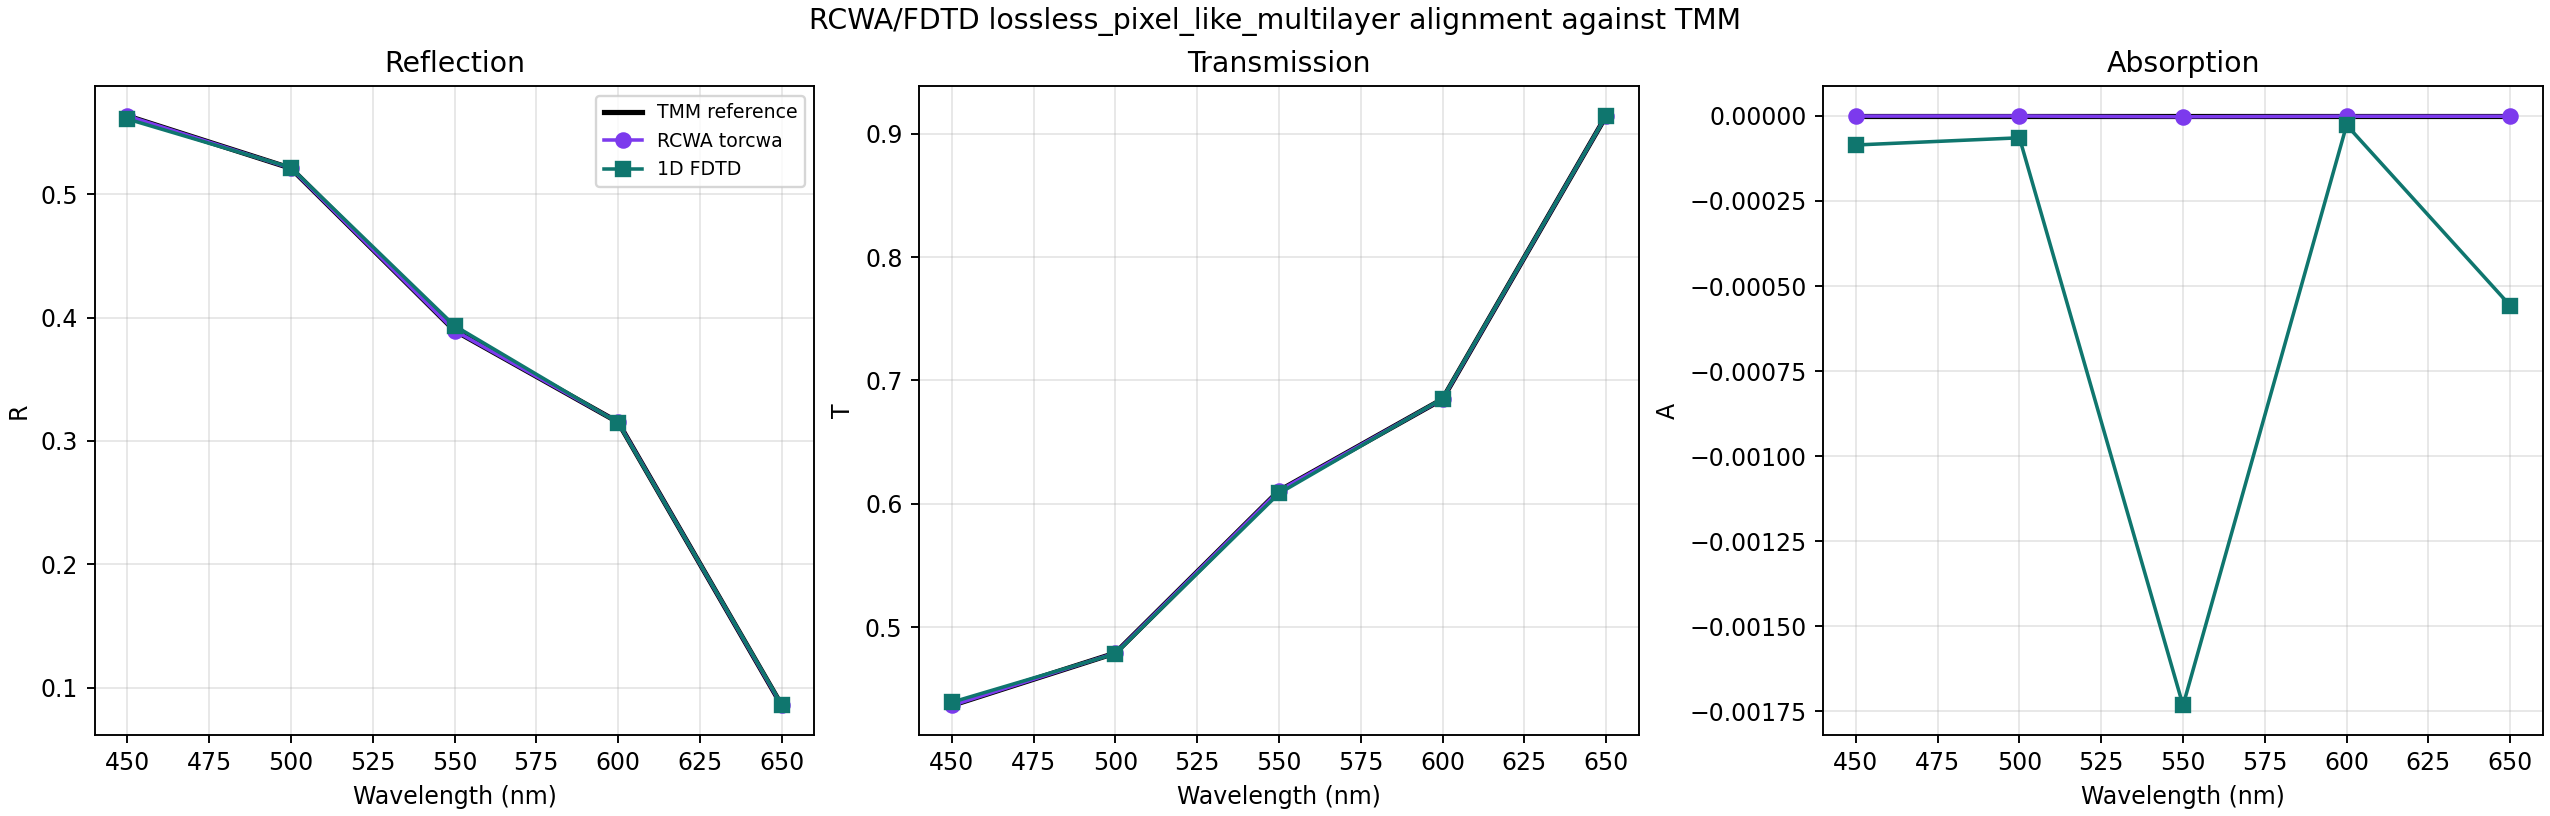
01 Spectrum Alignment
02 Alignment Errors
03 Fdtd Grid Convergence
1D lossy pixel-like multilayer: TMM vs torcwa RCWA vs 1D FDTD
01 Spectrum Alignment
02 Alignment Errors
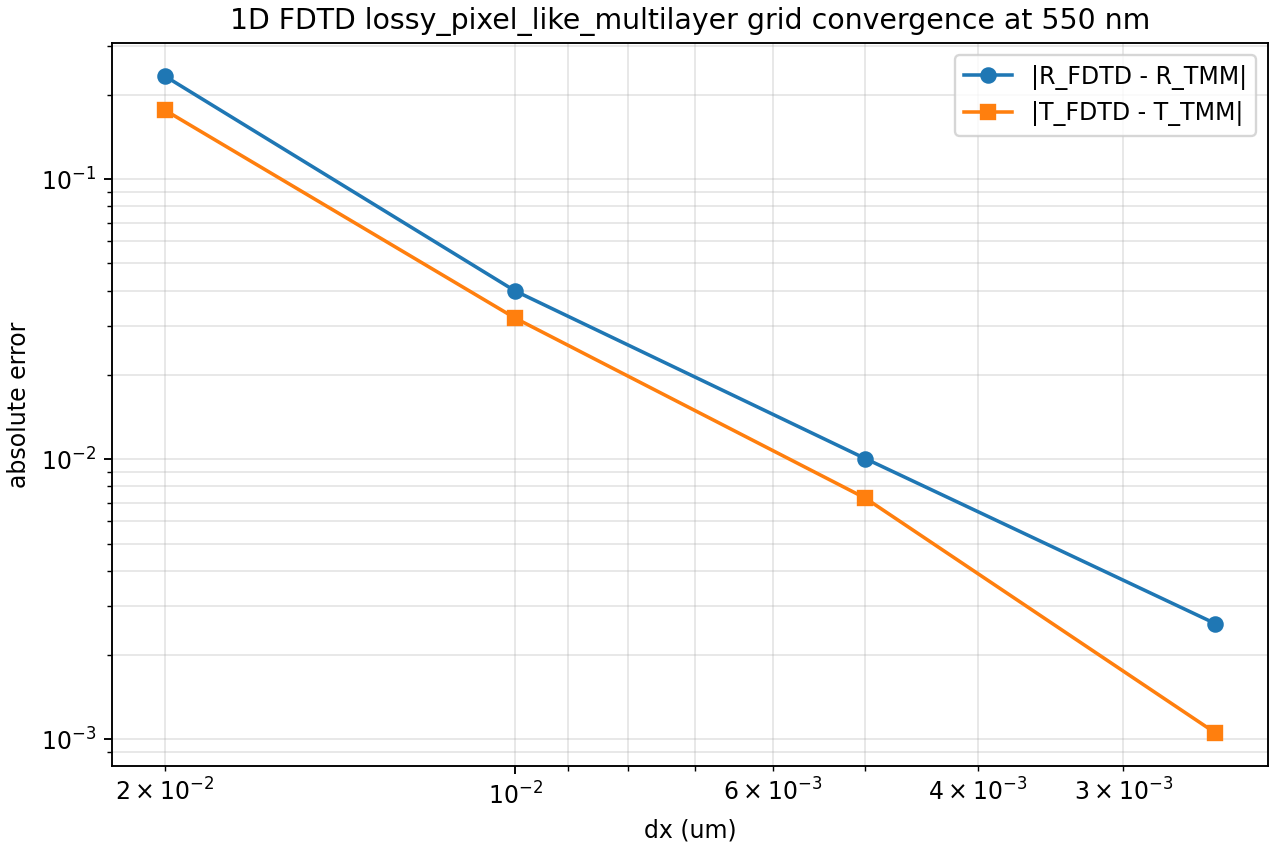
03 Fdtd Grid Convergence
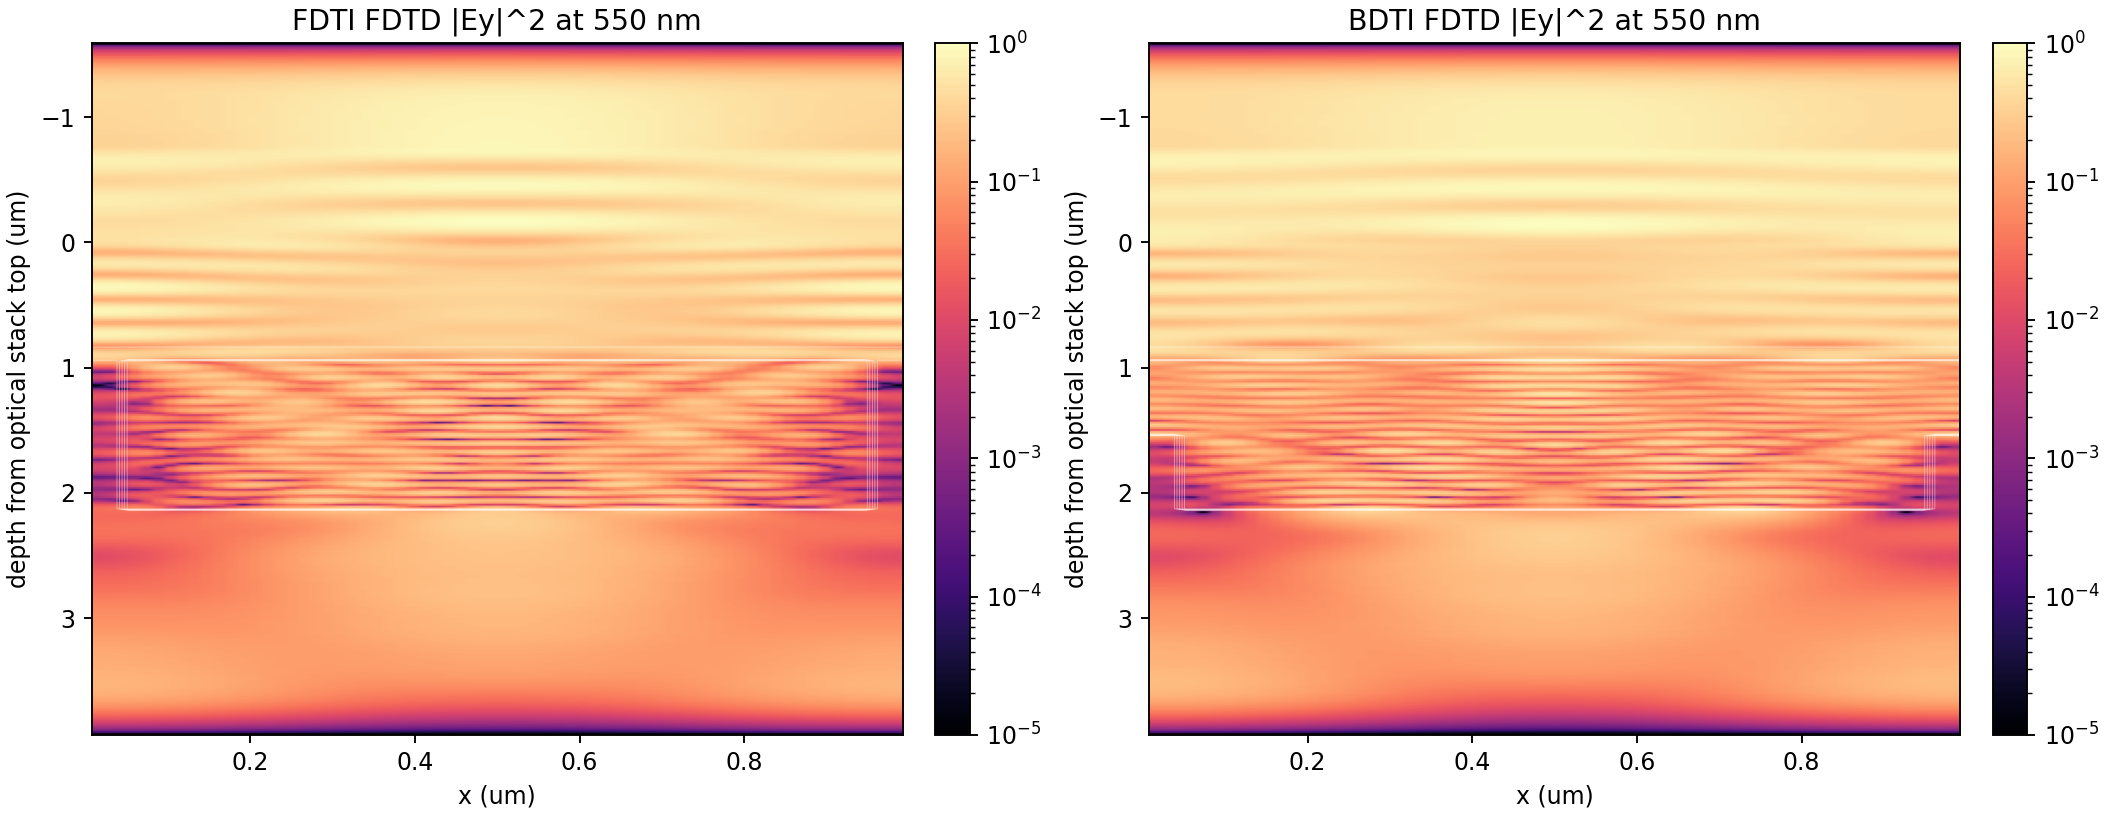
2D FDTI/BDTI periodic trench
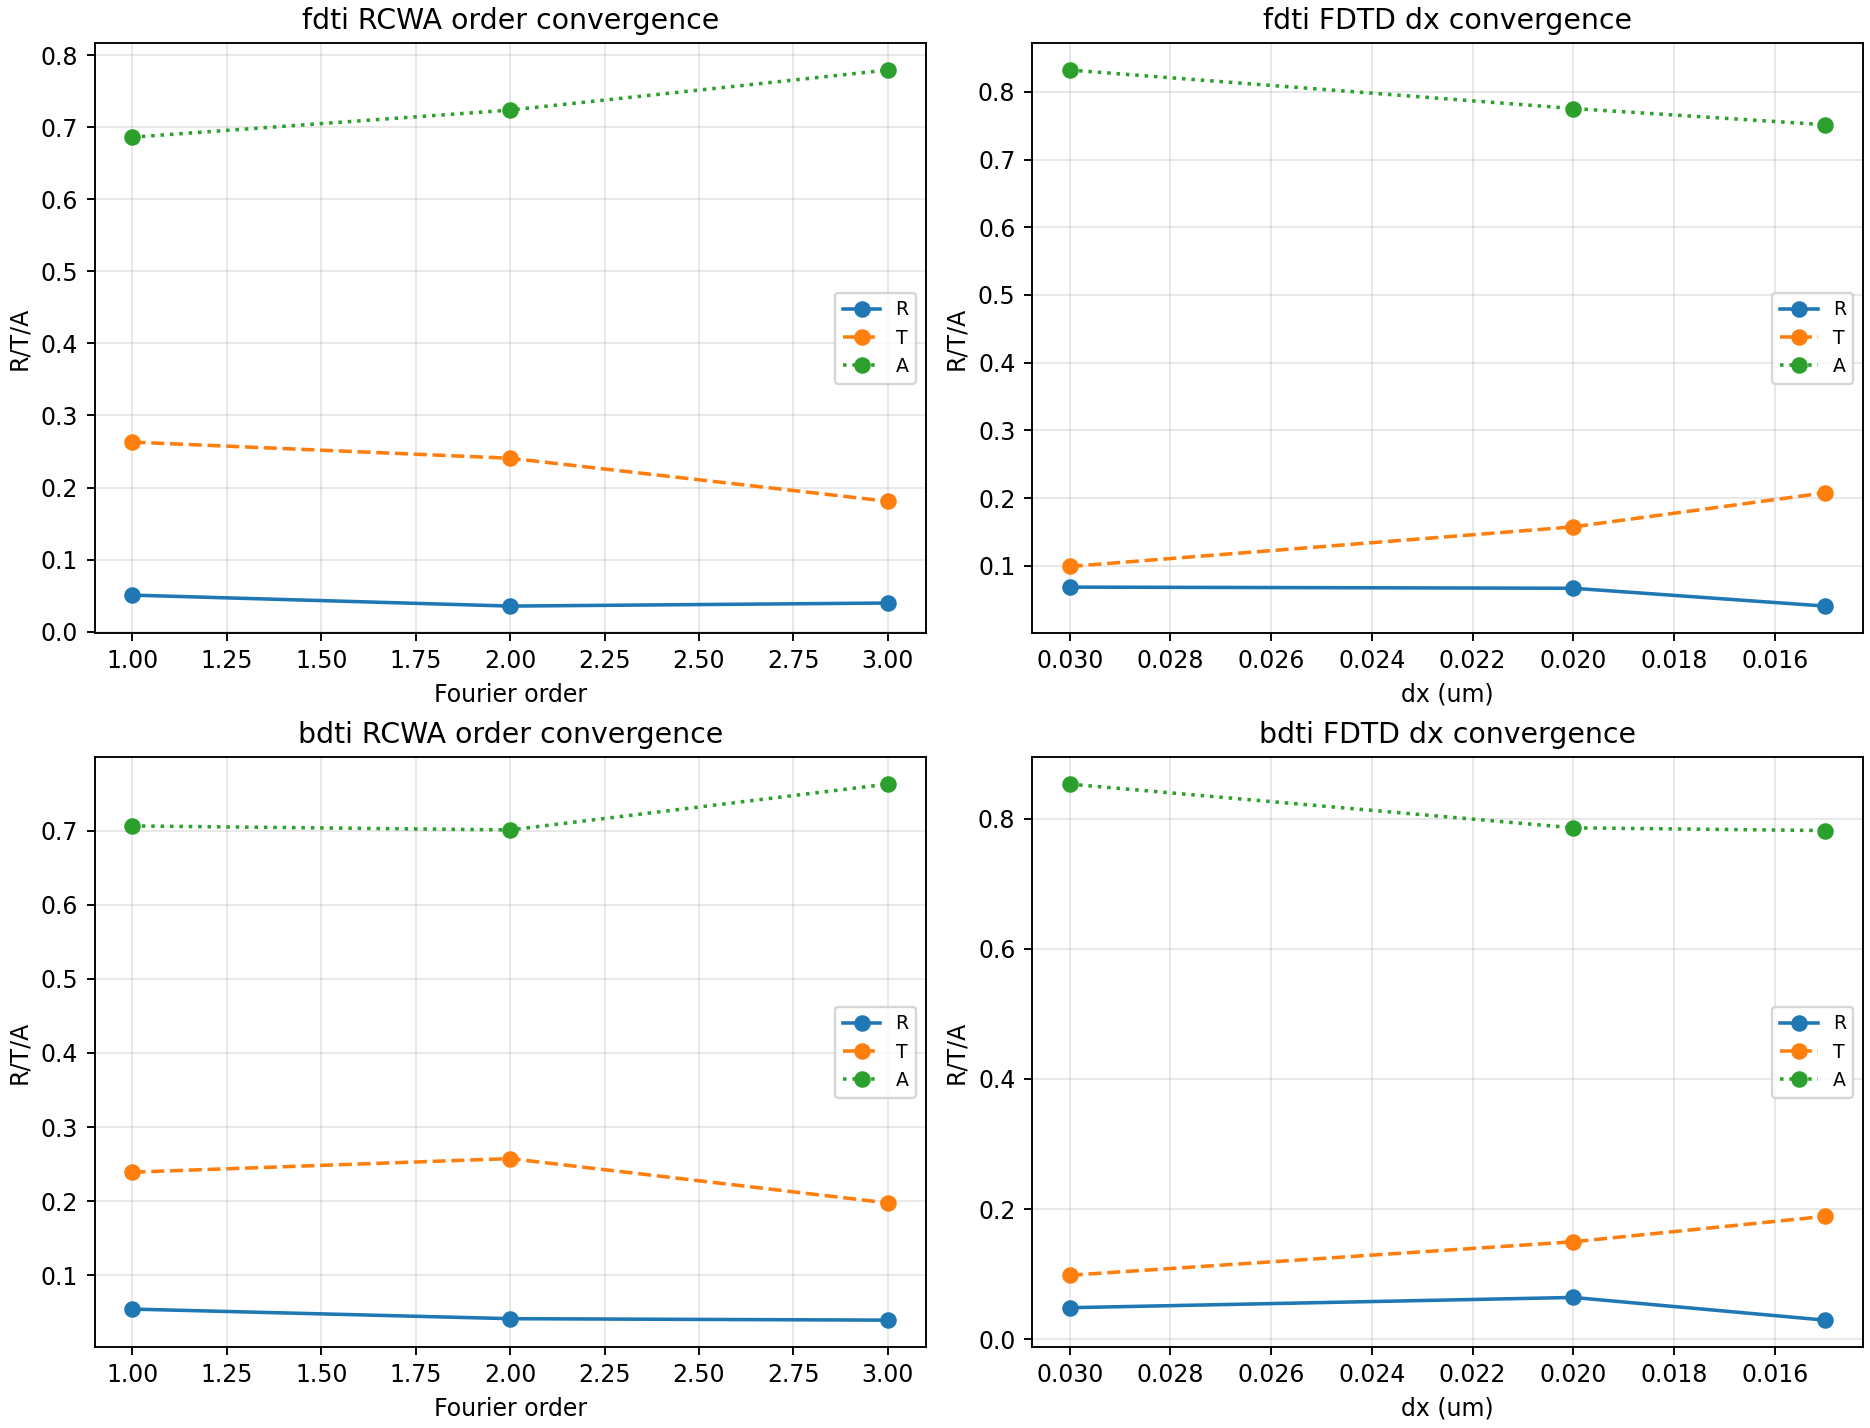
FDTI와 BDTI 방향성이 처음으로 실제 오차에 영향을 주는 단계다. 두 솔버가 같은 periodic trench 구조와 같은 R/T/A 정의를 사용한다.
| 모드 | RCWA order | FDTD dx um | max |dR| | max |dT| | max |dA| | field leakage | 정합 |
|---|---|---|---|---|---|---|---|
| FDTI | 3 | 0.015 | 0.0266 | 0.027 | 0.0278 | 0.1305 | yes |
| BDTI | 3 | 0.015 | 0.0183 | 0.0088 | 0.019 | 0.096 | yes |
2D periodic FDTI/BDTI trench: torcwa RCWA vs 2D TE FDTD
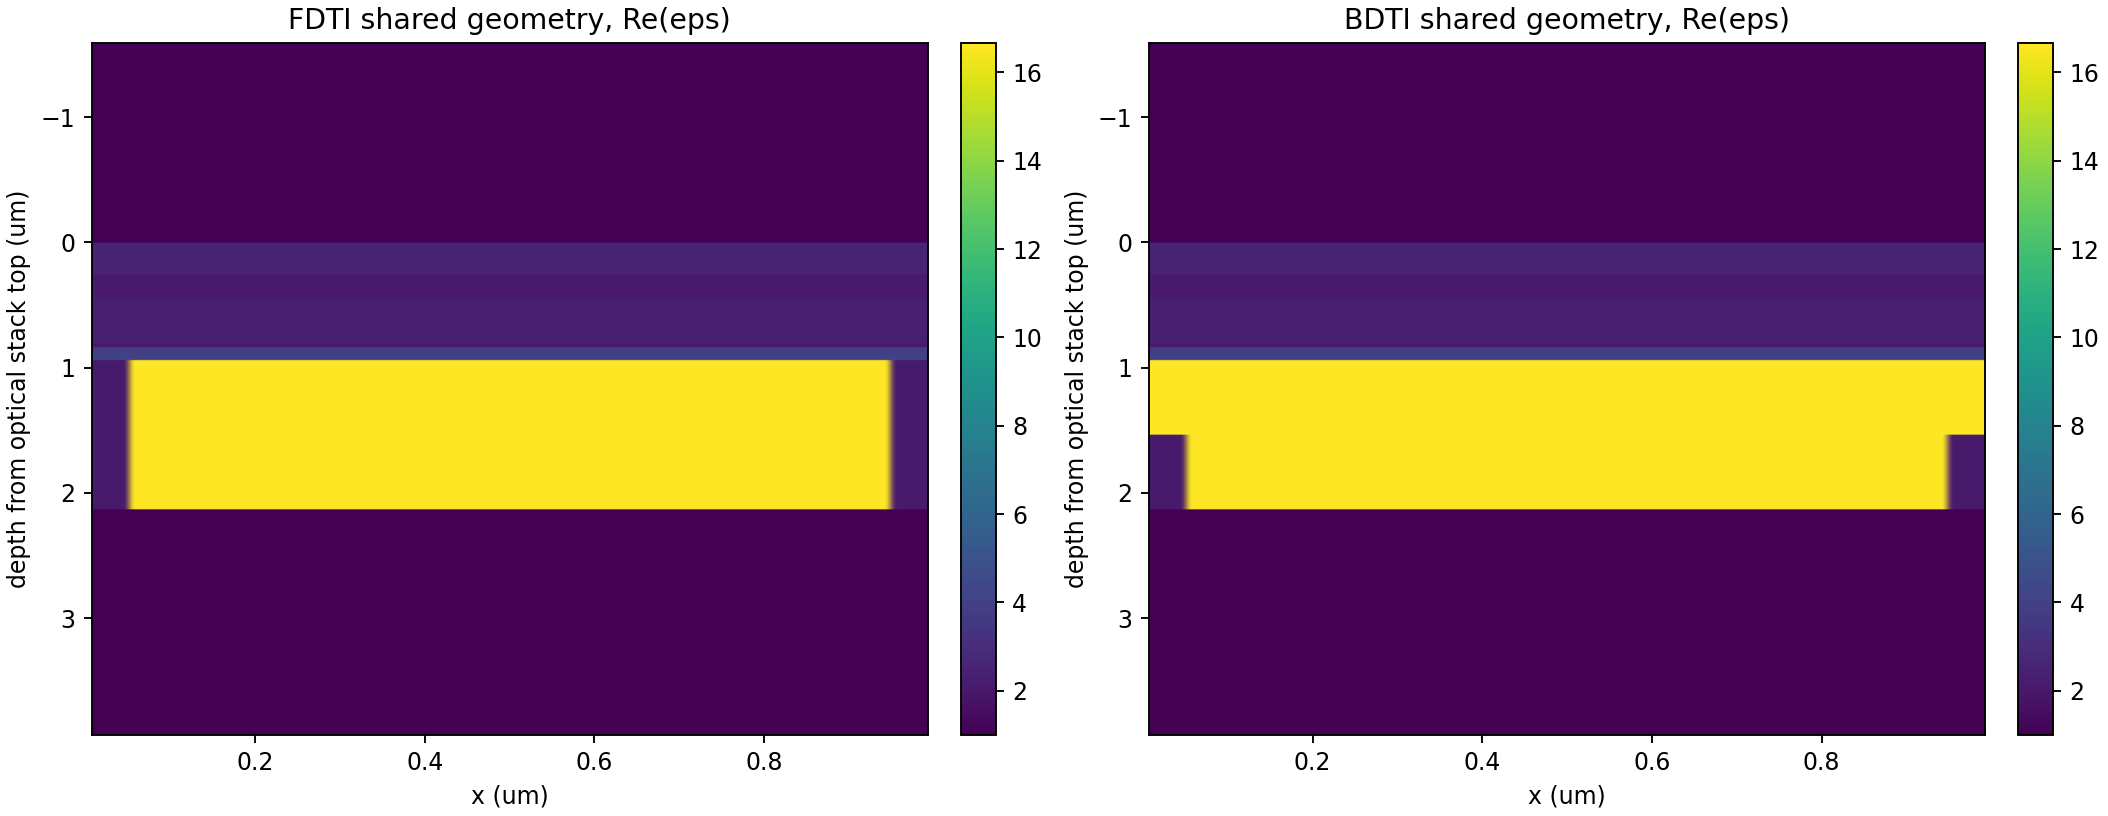
01 Shared Geometry
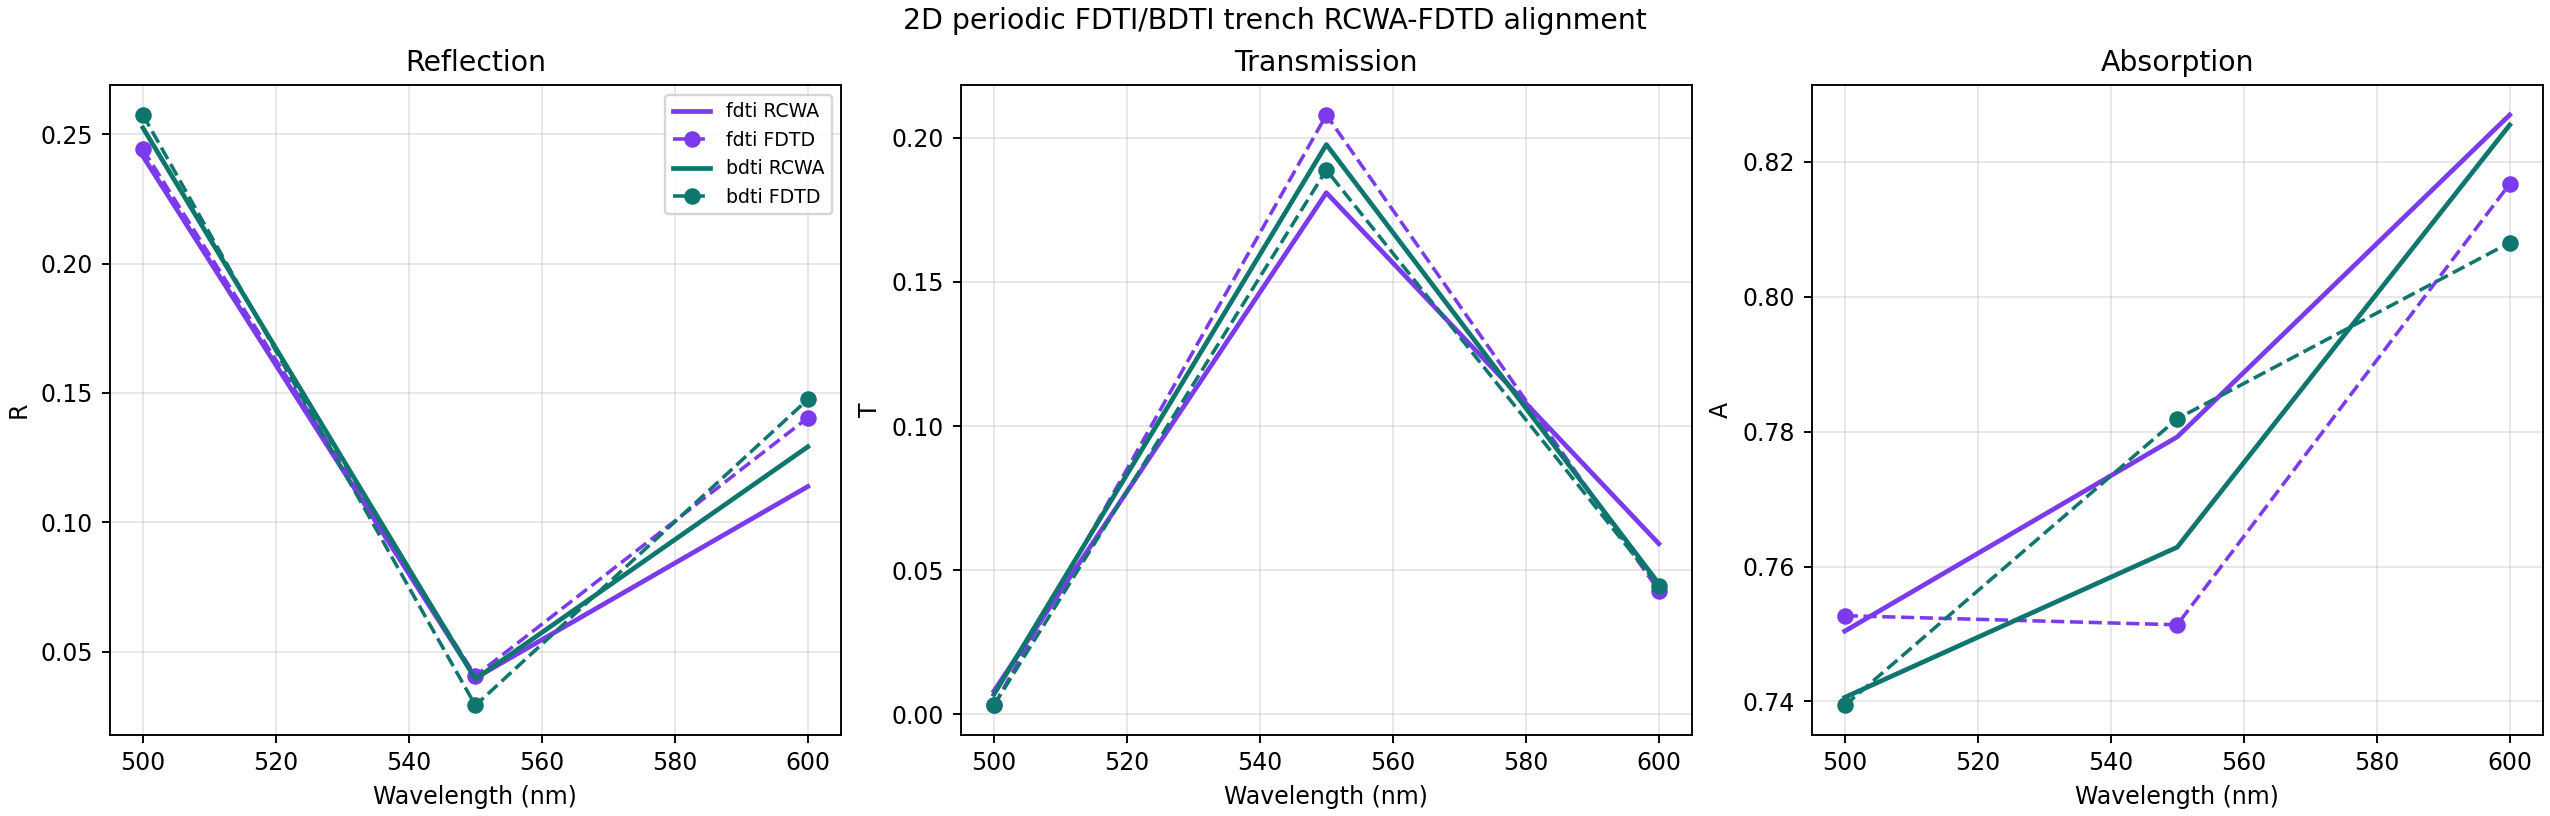
02 Spectrum Alignment
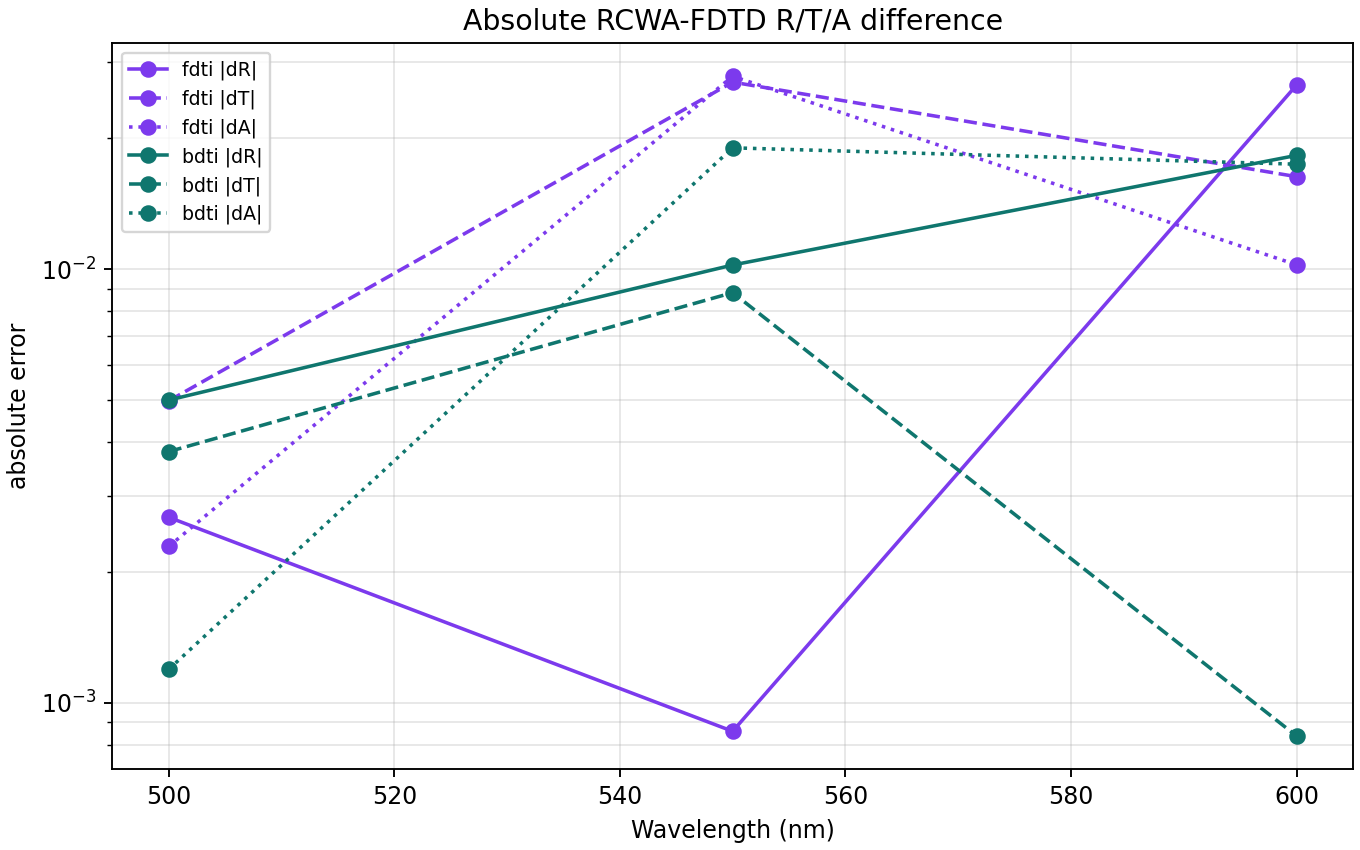
03 Rta Error
04 Fdtd Field Maps
05 Convergence
전체 2x2 Bayer pixel 수렴
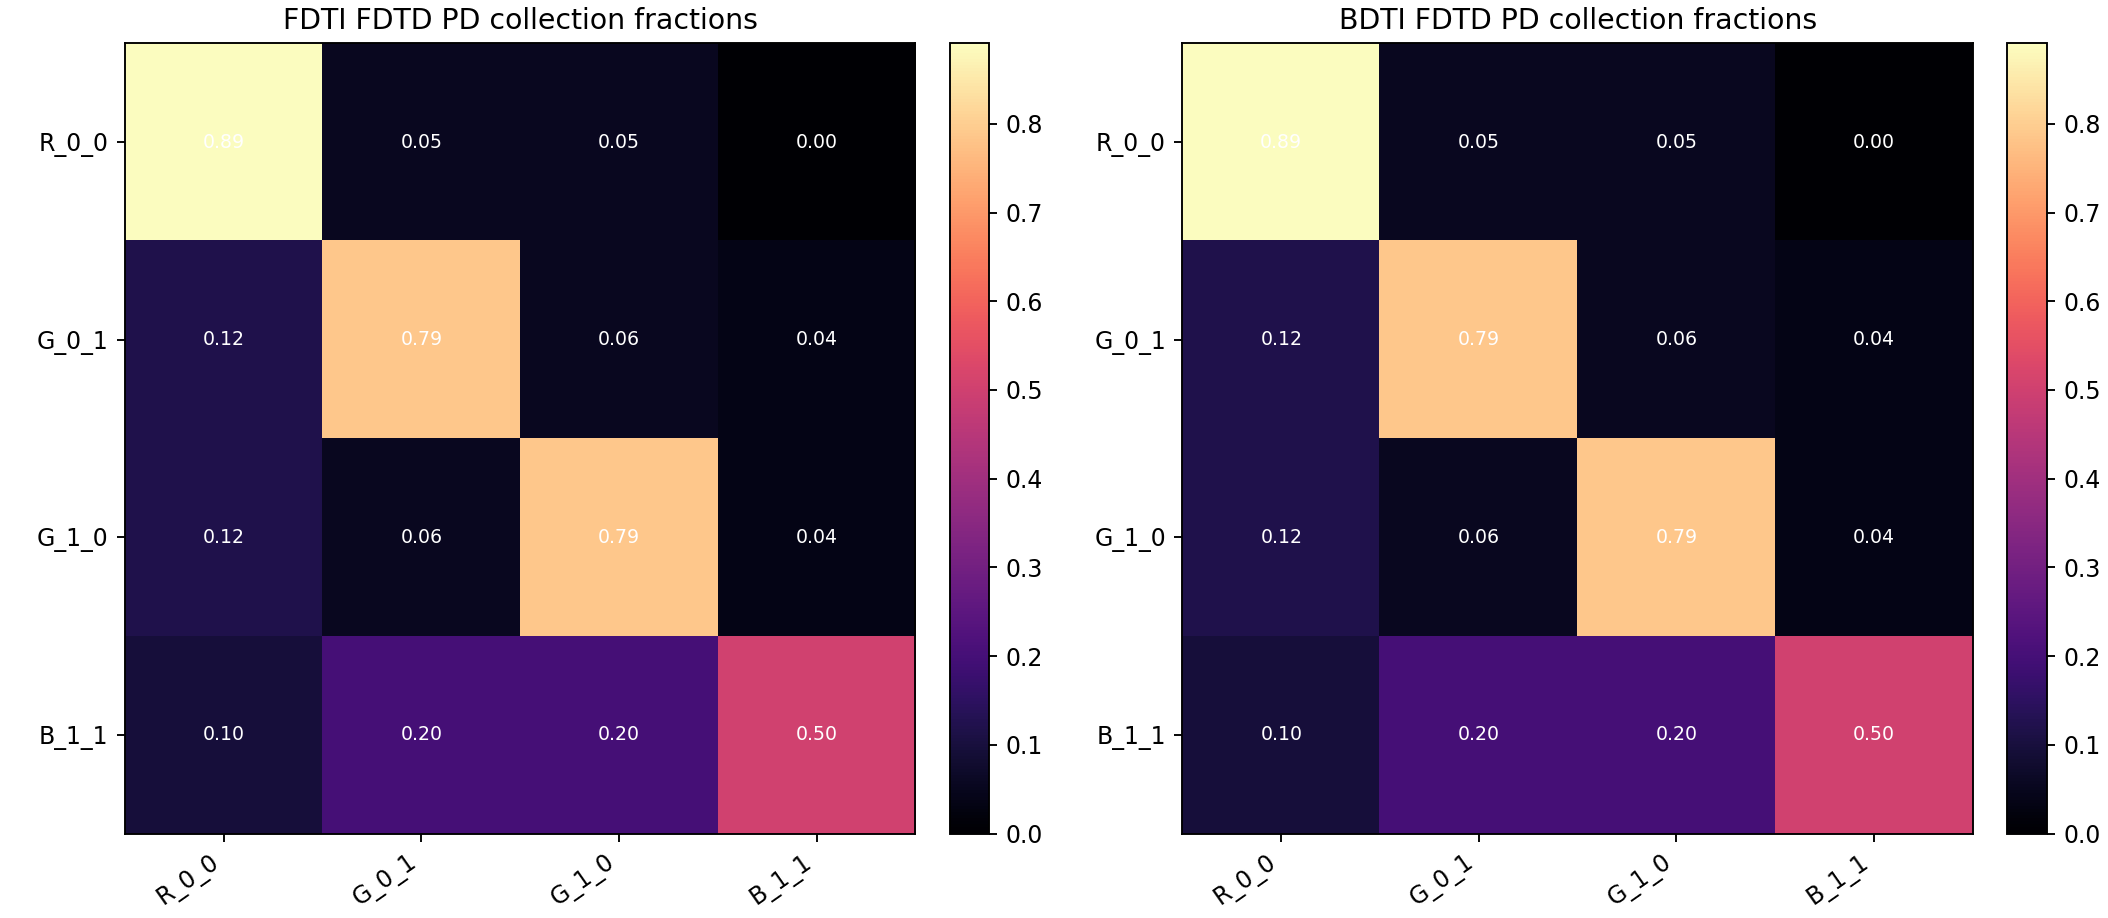
Pixel benchmark는 실제 PixelStack 경로를 사용한다. FDTI/BDTI 옵션, 복소 굴절률 재료, BARL, microlens slice, color filter, photodiode integration window가 모두 들어간다. RCWA는 full-supercell R/T/A를, scalar FDTD는 localized-source collection 및 crosstalk proxy를 보고한다.
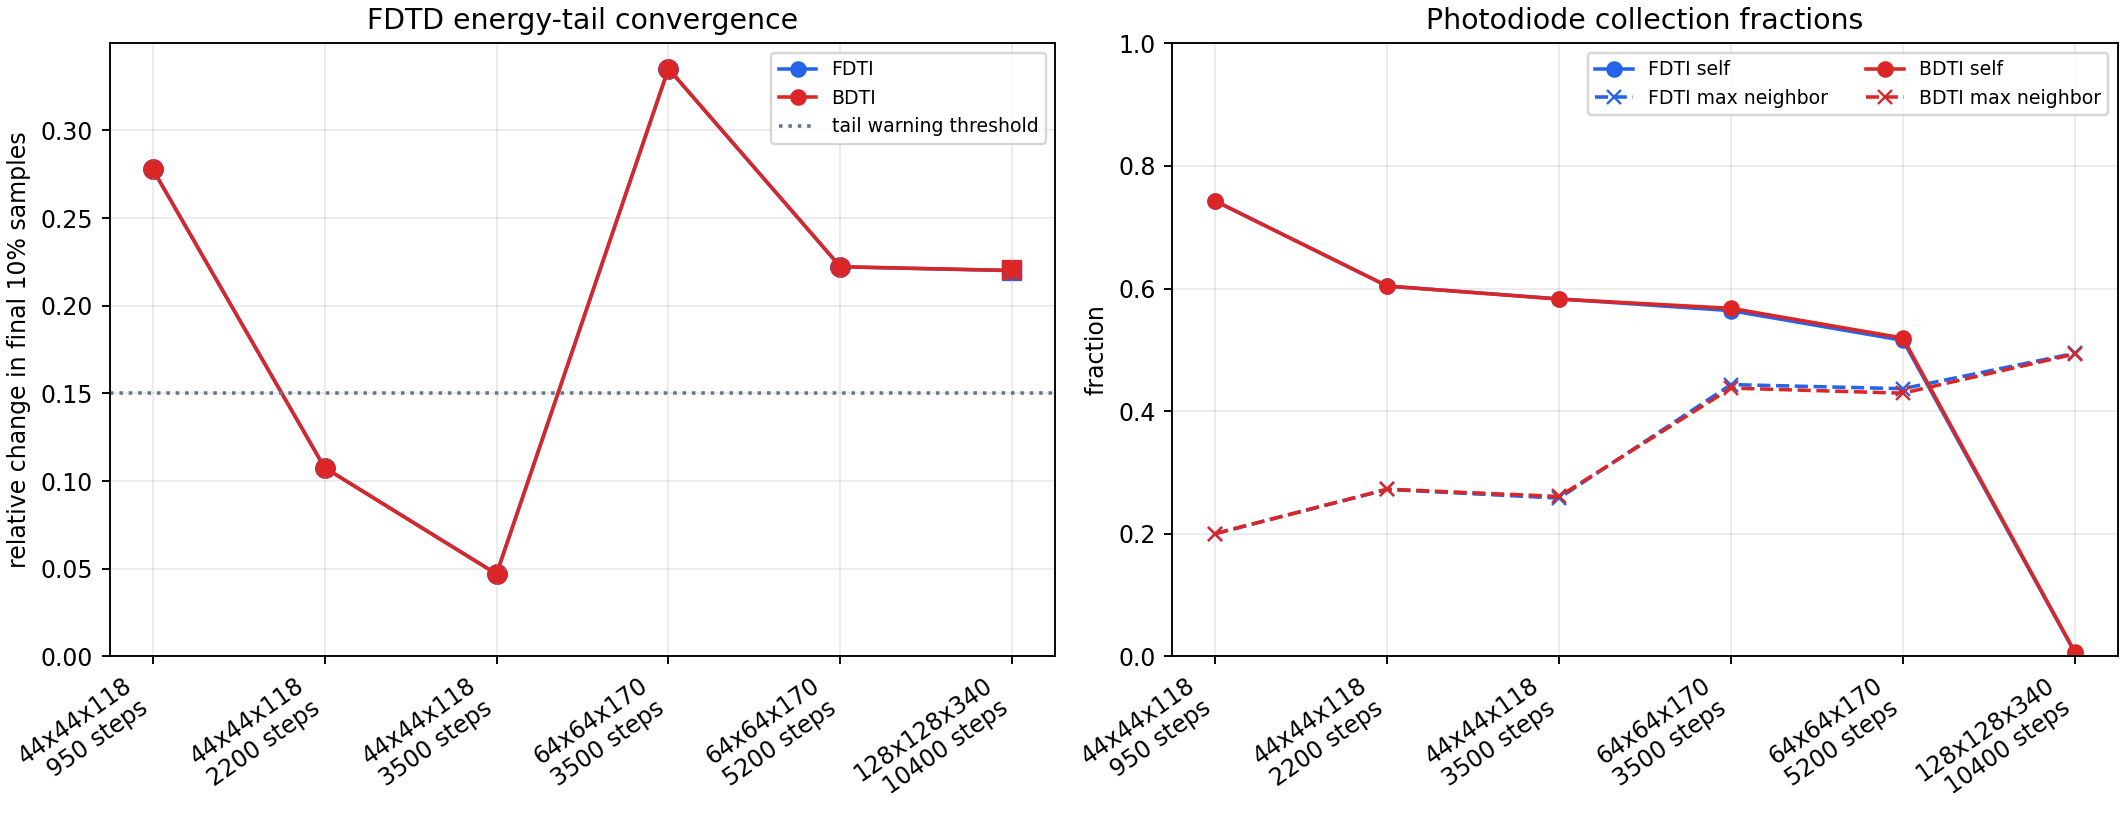
사용 가능한 모든 pixel benchmark metric에서 생성한 수렴 요약.
| Grid | steps | sources | mode | dx um | c*time um | self frac | max neighbor | tail | warnings |
|---|---|---|---|---|---|---|---|---|---|
| 44x44x118 | 950 | all | FDTI | 0.0455 | 9.5962 | 0.7426 | 0.2003 | 0.278 | 1 |
| 44x44x118 | 950 | all | BDTI | 0.0455 | 9.5962 | 0.7426 | 0.2003 | 0.278 | 1 |
| 44x44x118 | 2200 | all | FDTI | 0.0455 | 22.2228 | 0.6041 | 0.2724 | 0.1077 | 0 |
| 44x44x118 | 2200 | all | BDTI | 0.0455 | 22.2228 | 0.6041 | 0.2728 | 0.1077 | 0 |
| 44x44x118 | 3500 | all | FDTI | 0.0455 | 35.3544 | 0.5831 | 0.2582 | 0.0471 | 0 |
| 44x44x118 | 3500 | all | BDTI | 0.0455 | 35.3544 | 0.5827 | 0.2609 | 0.047 | 0 |
| 64x64x170 | 3500 | all | FDTI | 0.0312 | 24.3794 | 0.5639 | 0.4434 | 0.3352 | 1 |
| 64x64x170 | 3500 | all | BDTI | 0.0312 | 24.3794 | 0.5677 | 0.4377 | 0.3353 | 1 |
| 64x64x170 | 5200 | all | FDTI | 0.0312 | 36.2208 | 0.5155 | 0.4367 | 0.2222 | 1 |
| 64x64x170 | 5200 | all | BDTI | 0.0312 | 36.2208 | 0.5192 | 0.4293 | 0.2223 | 1 |
| 128x128x340 | 10400 | single | FDTI | 0.0156 | 36.2208 | 0.0061 | 0.4945 | 0.22 | 1 |
| 128x128x340 | 10400 | single | BDTI | 0.0156 | 36.2208 | 0.0071 | 0.4933 | 0.2201 | 1 |
Pixel plots
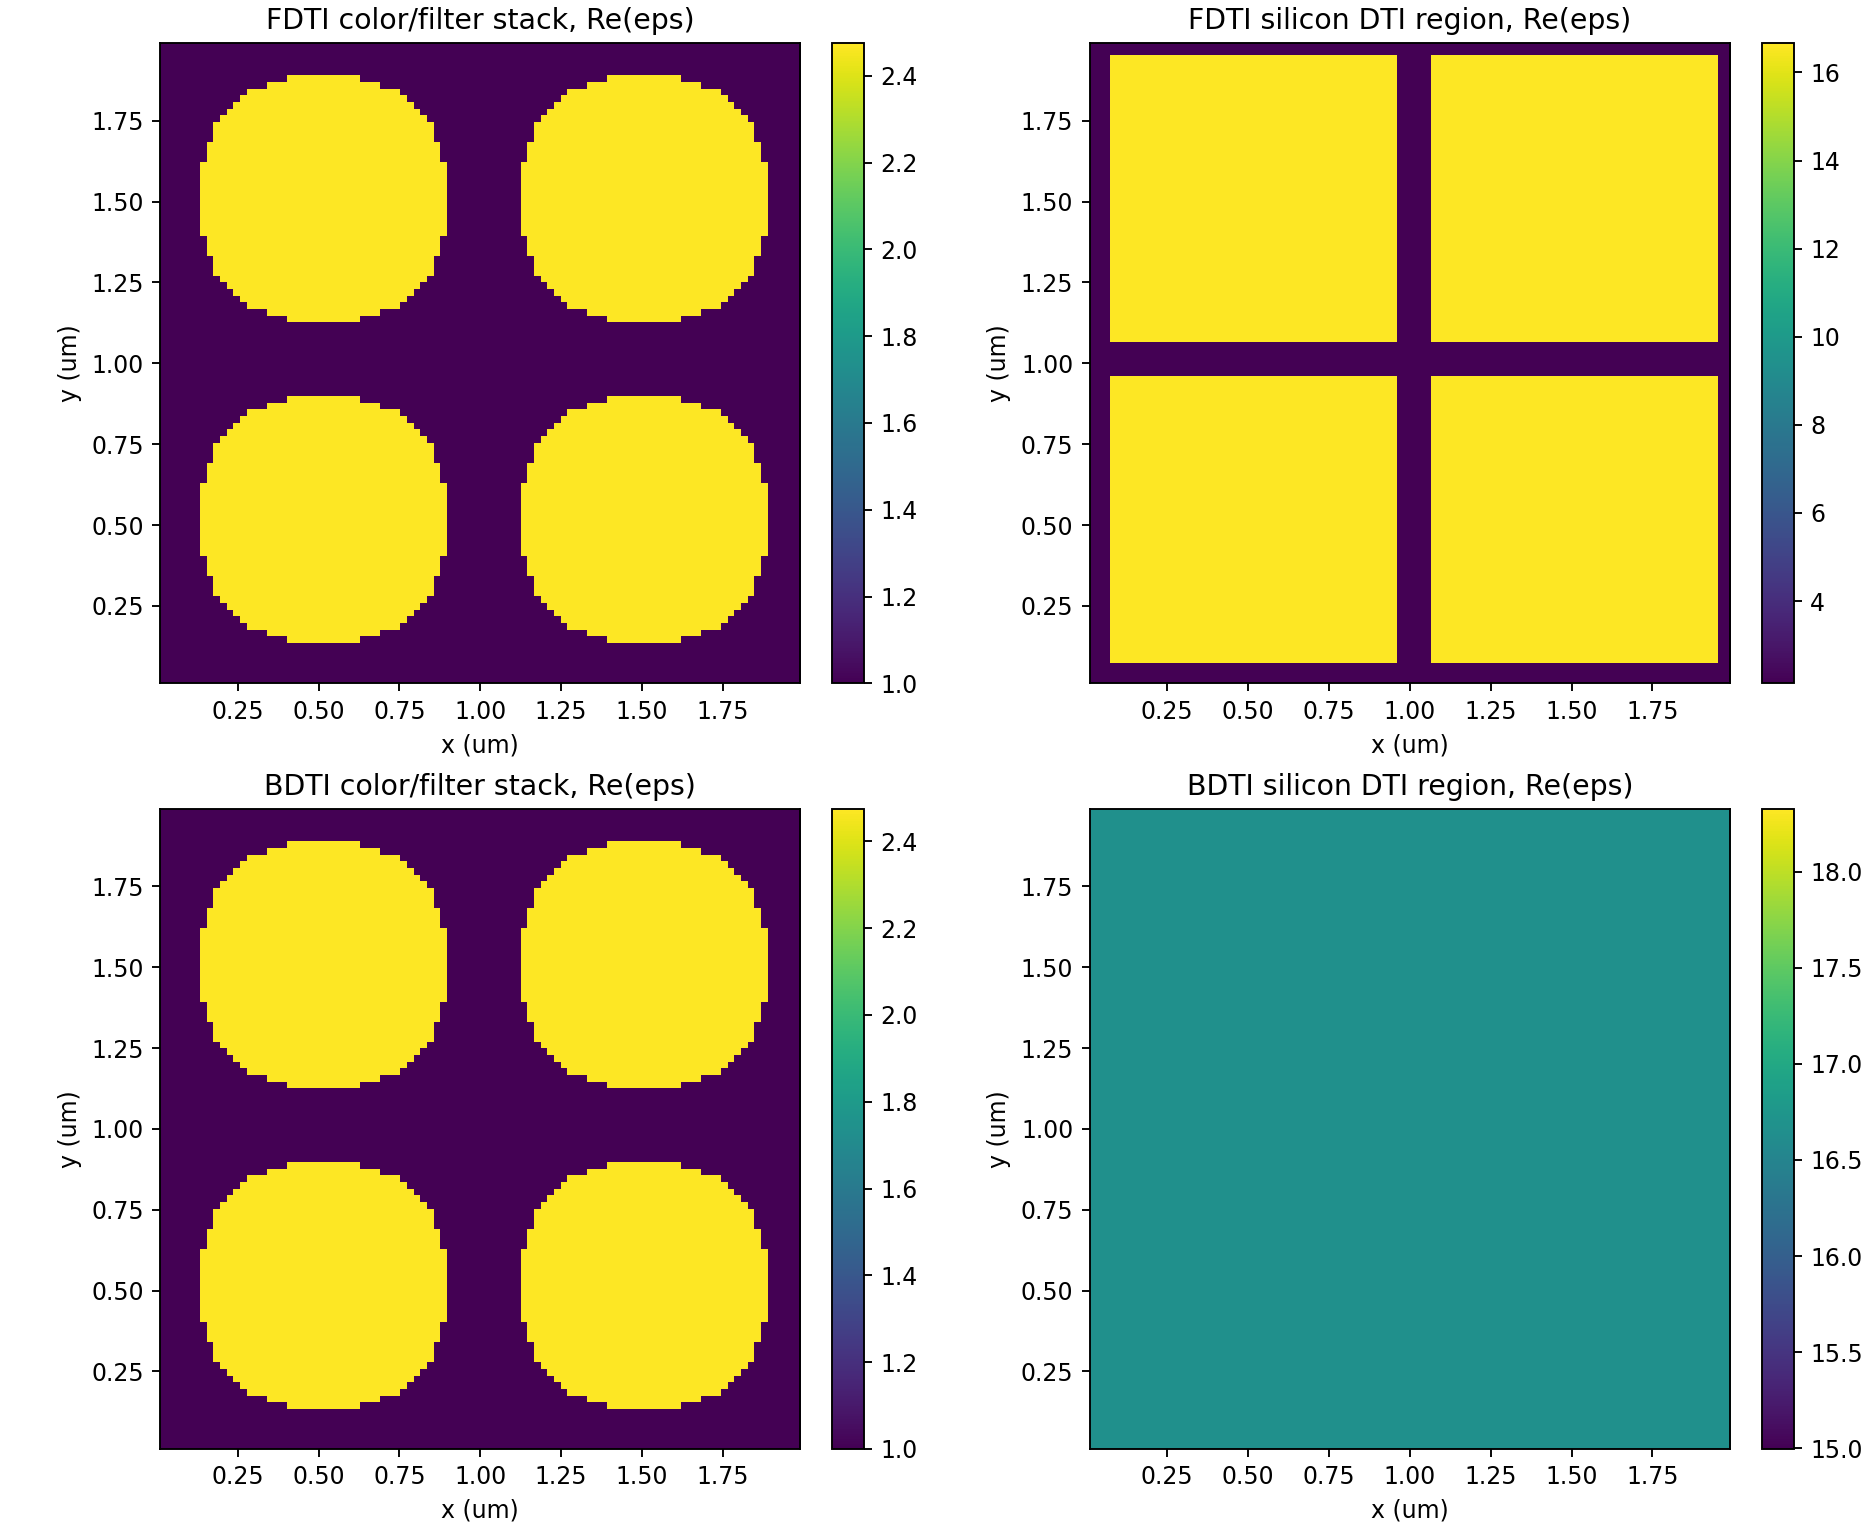
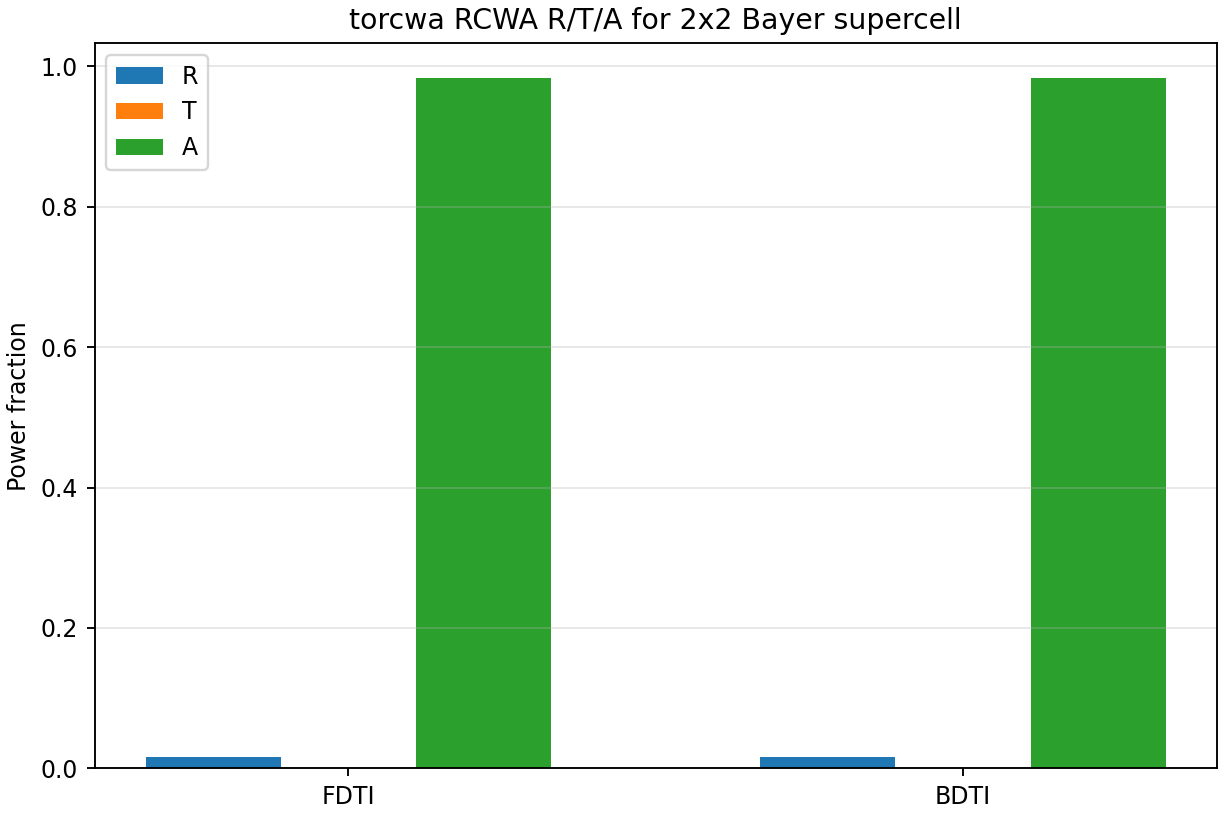
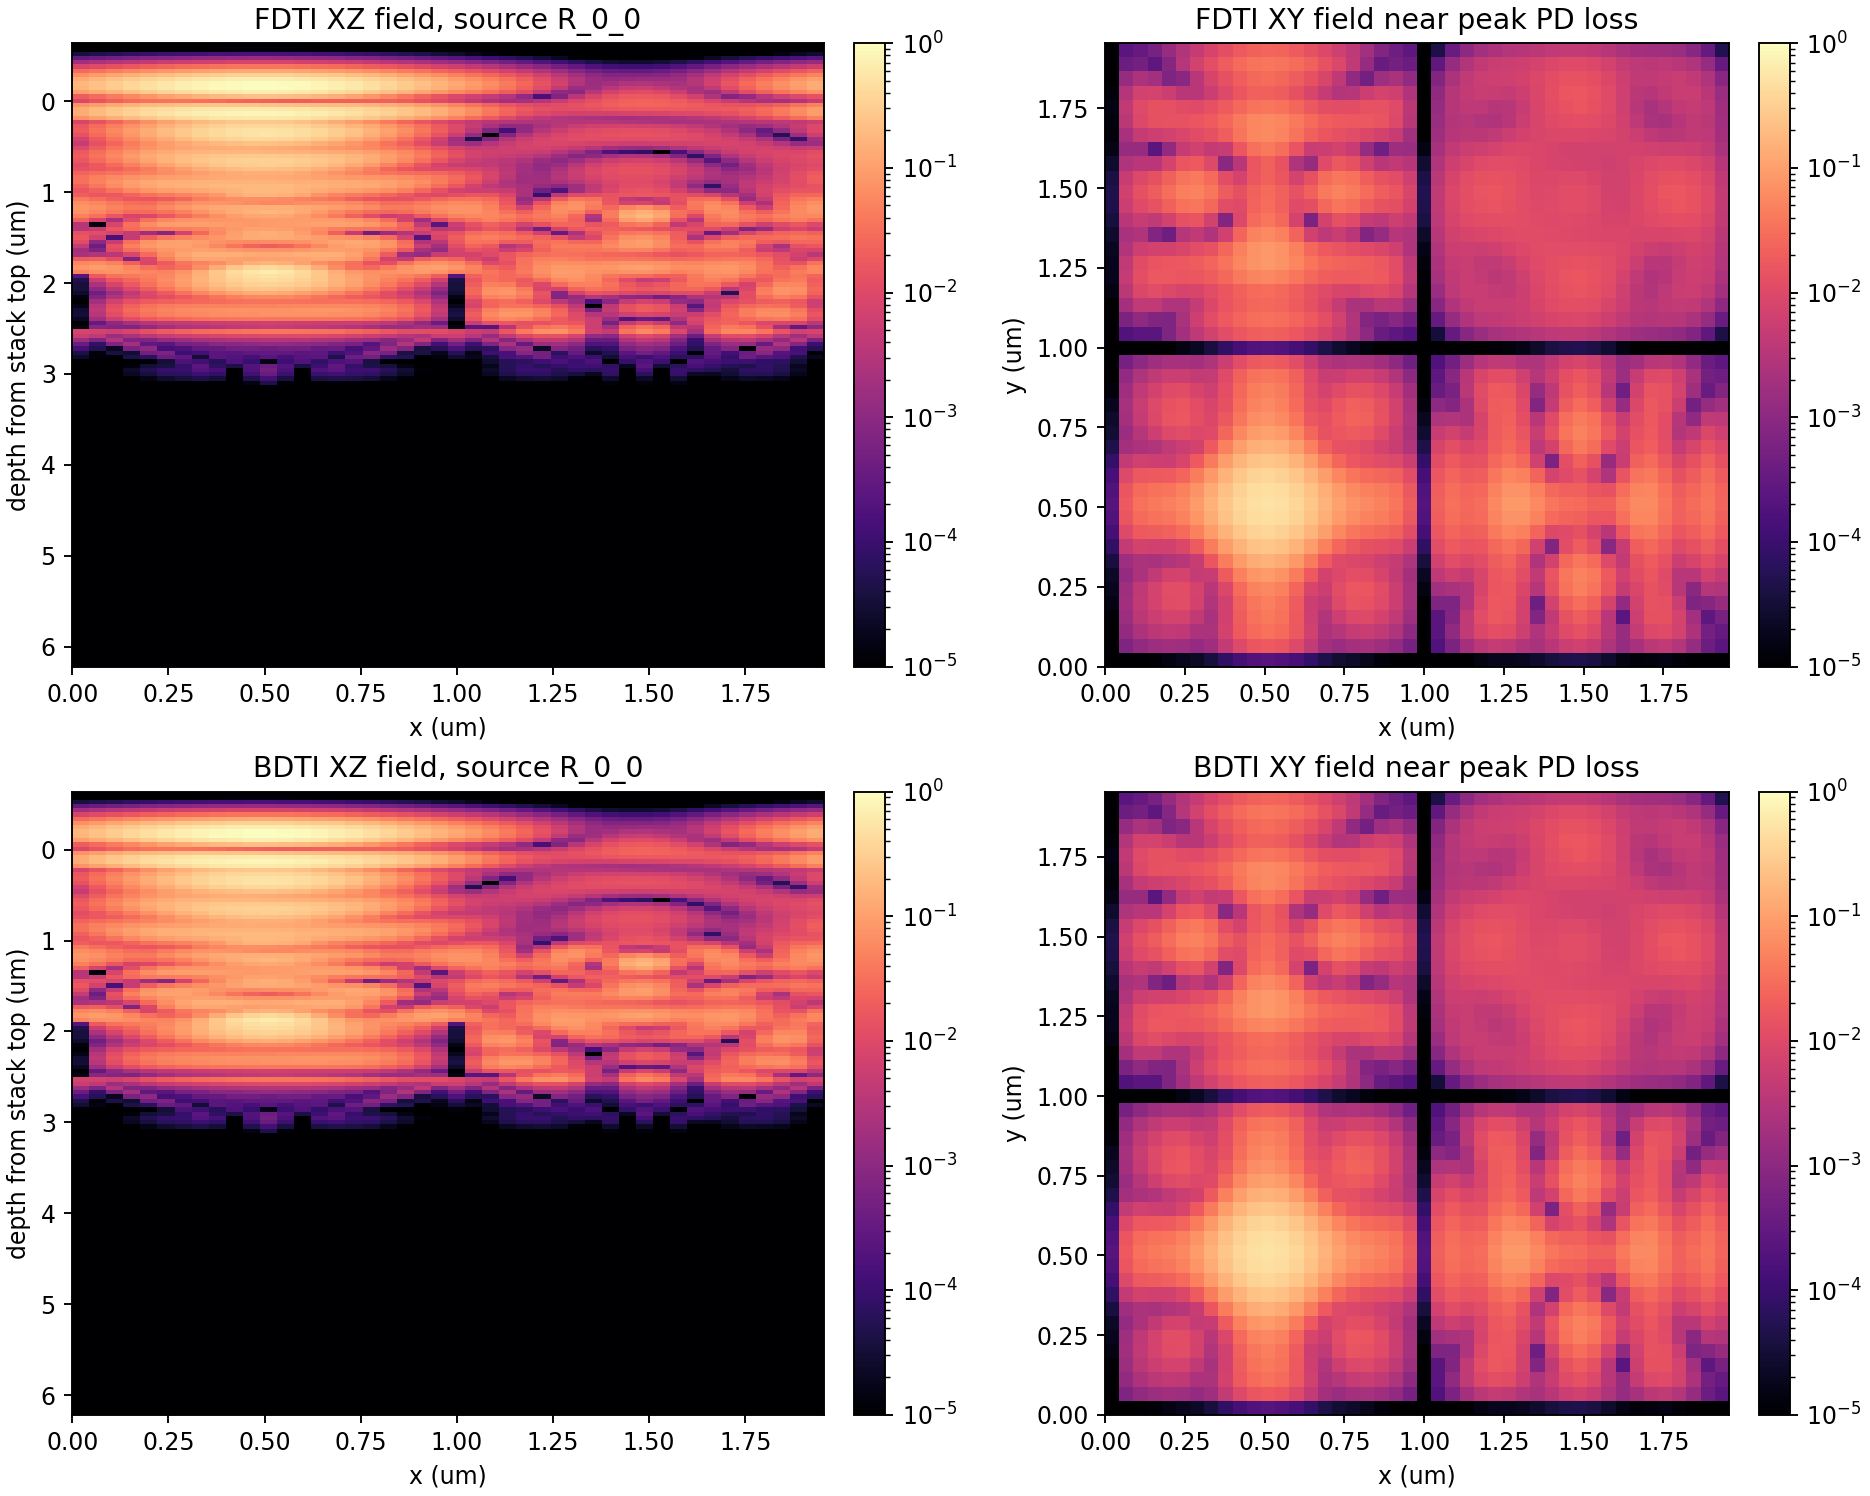
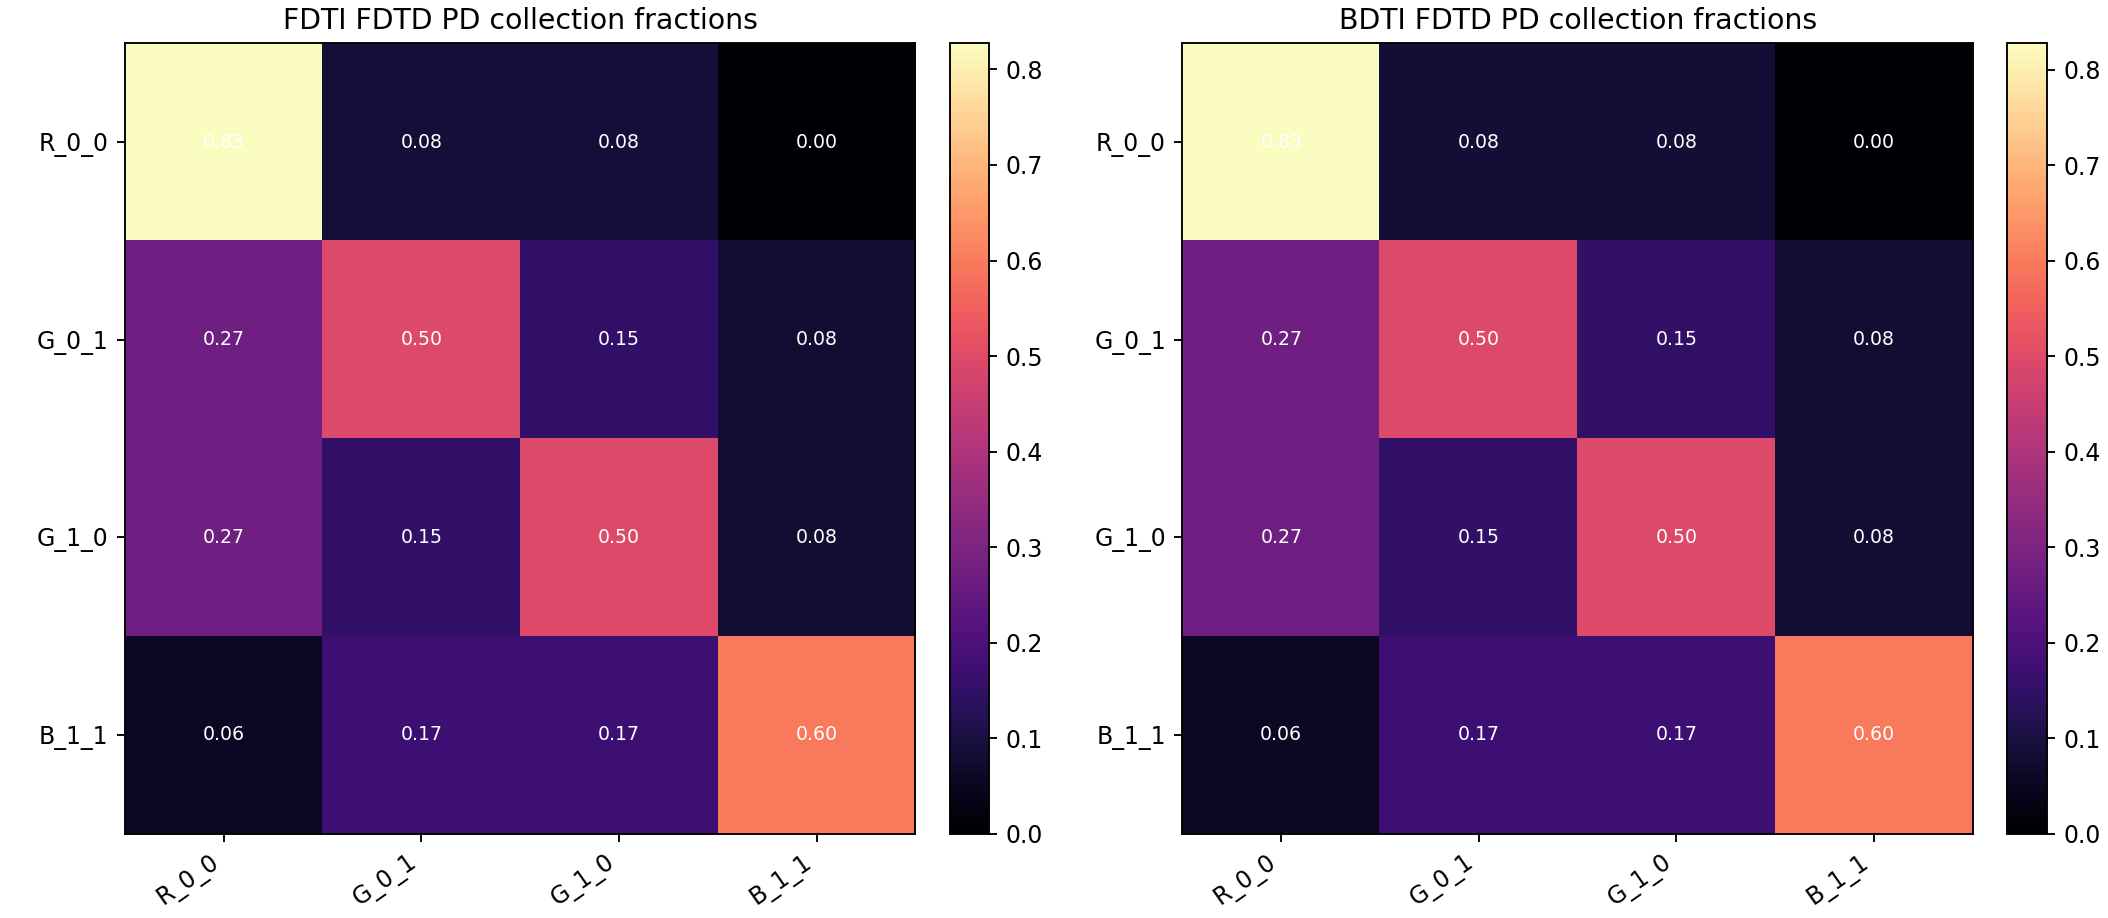
Benchmark 폴더에는 run마다 geometry와 RCWA R/T/A 이미지가 들어 있지만, 두 그림은 같은 물리적 2x2 BSI stack과 같은 RCWA 기준값을 사용하므로 의도적으로 동일하다. 아래에는 한 번만 표시한다. Run별 섹션에는 grid, runtime, source 설정에 따라 달라지는 FDTD crosstalk matrix와 field slice만 표시한다.
공통 geometry 및 RCWA 기준
01 Geometry Slices
02 Rcwa Rta
2x2 pixel scalar FDTD, 44x44x118, 950 steps
03 Fdtd Crosstalk Matrix
04 Fdtd Field Slices
2x2 pixel scalar FDTD, 44x44x118, 2200 steps
03 Fdtd Crosstalk Matrix
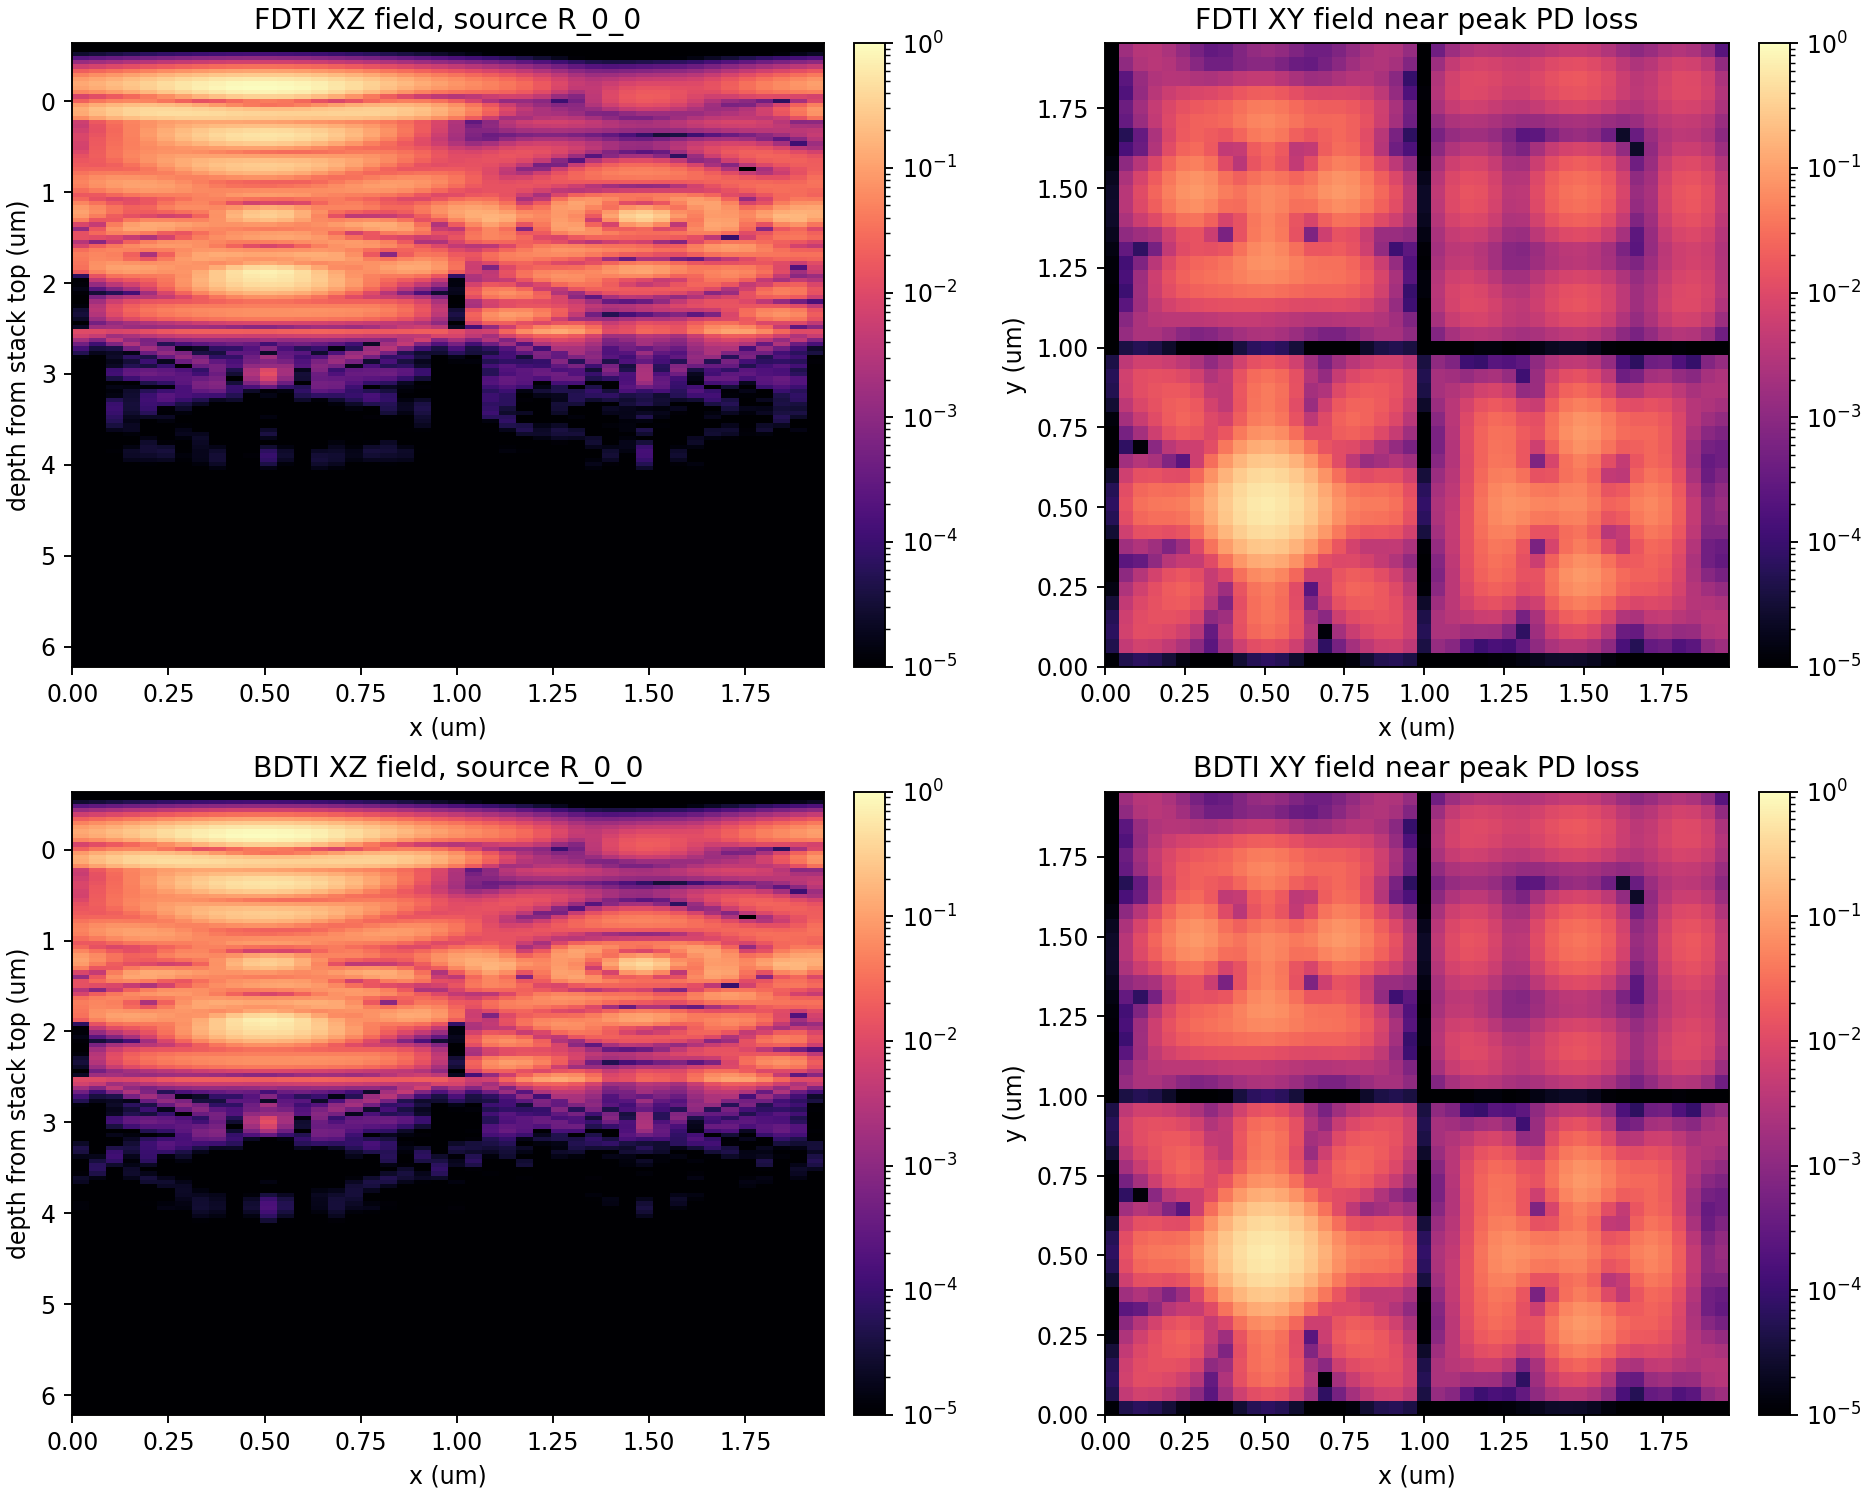
04 Fdtd Field Slices
2x2 pixel scalar FDTD, 44x44x118, 3500 steps
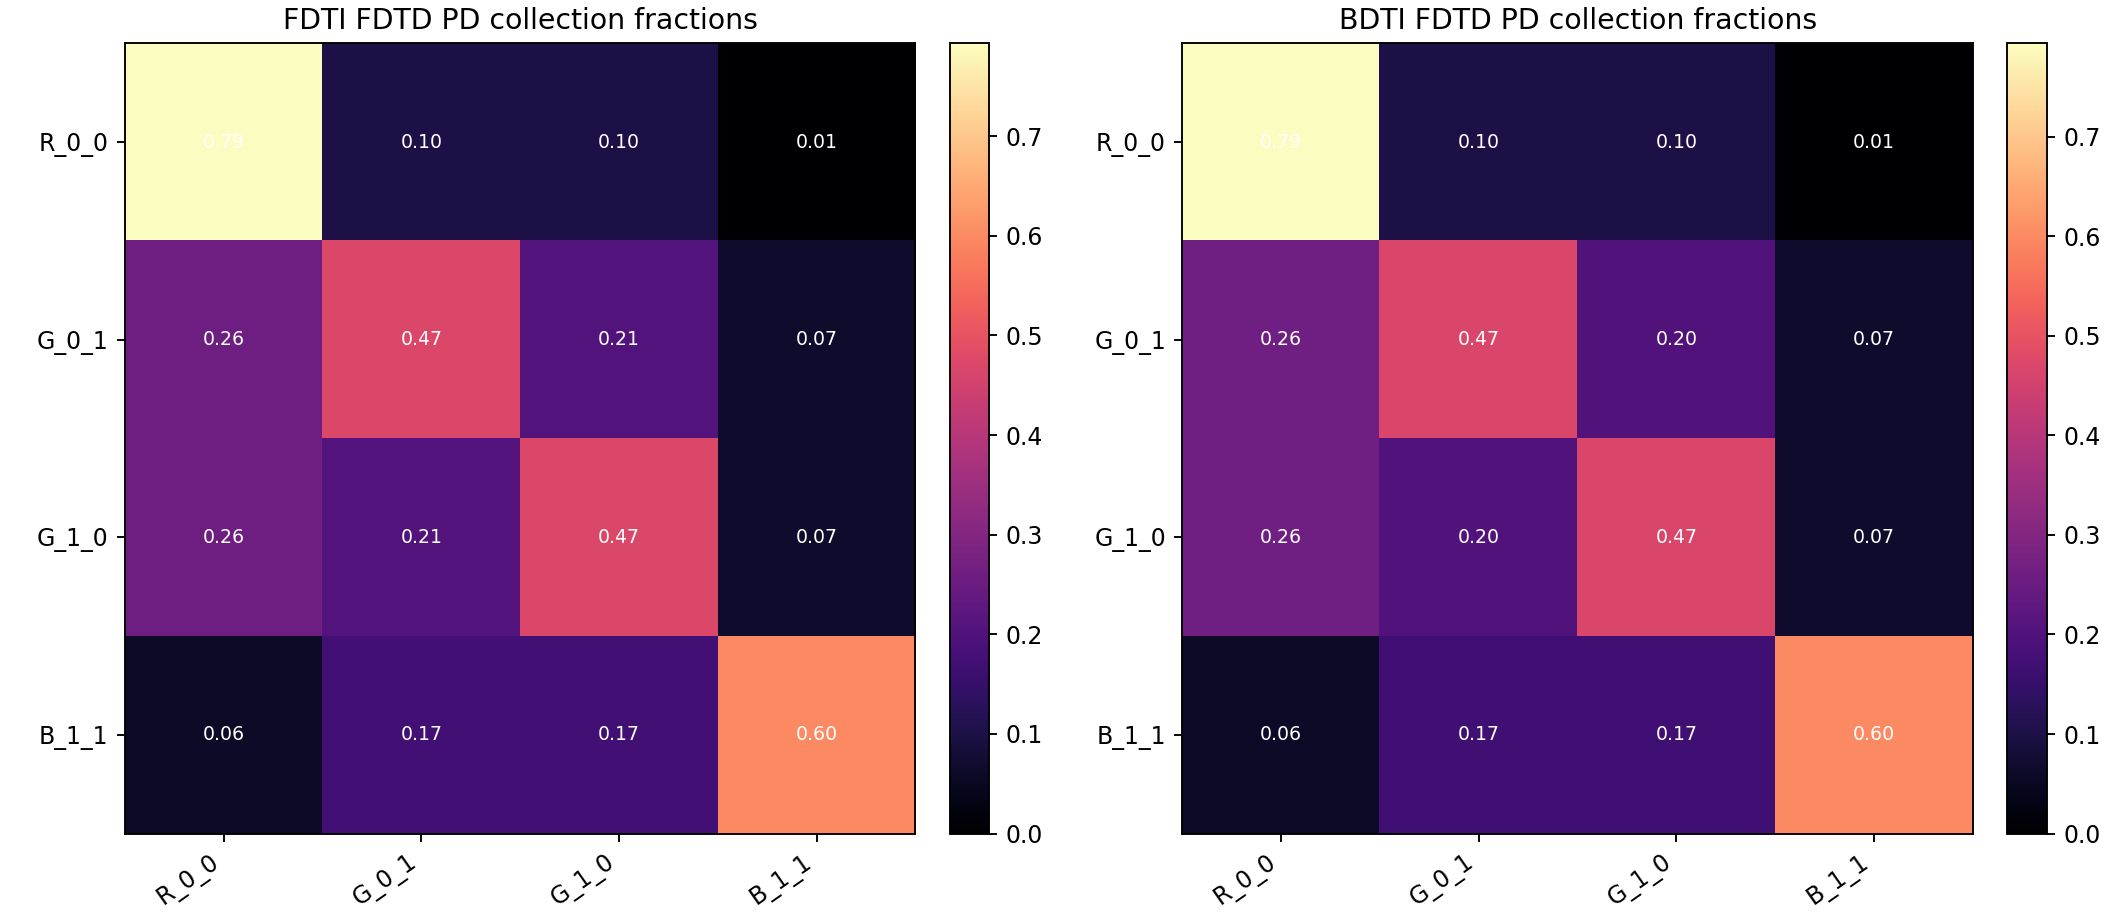
03 Fdtd Crosstalk Matrix
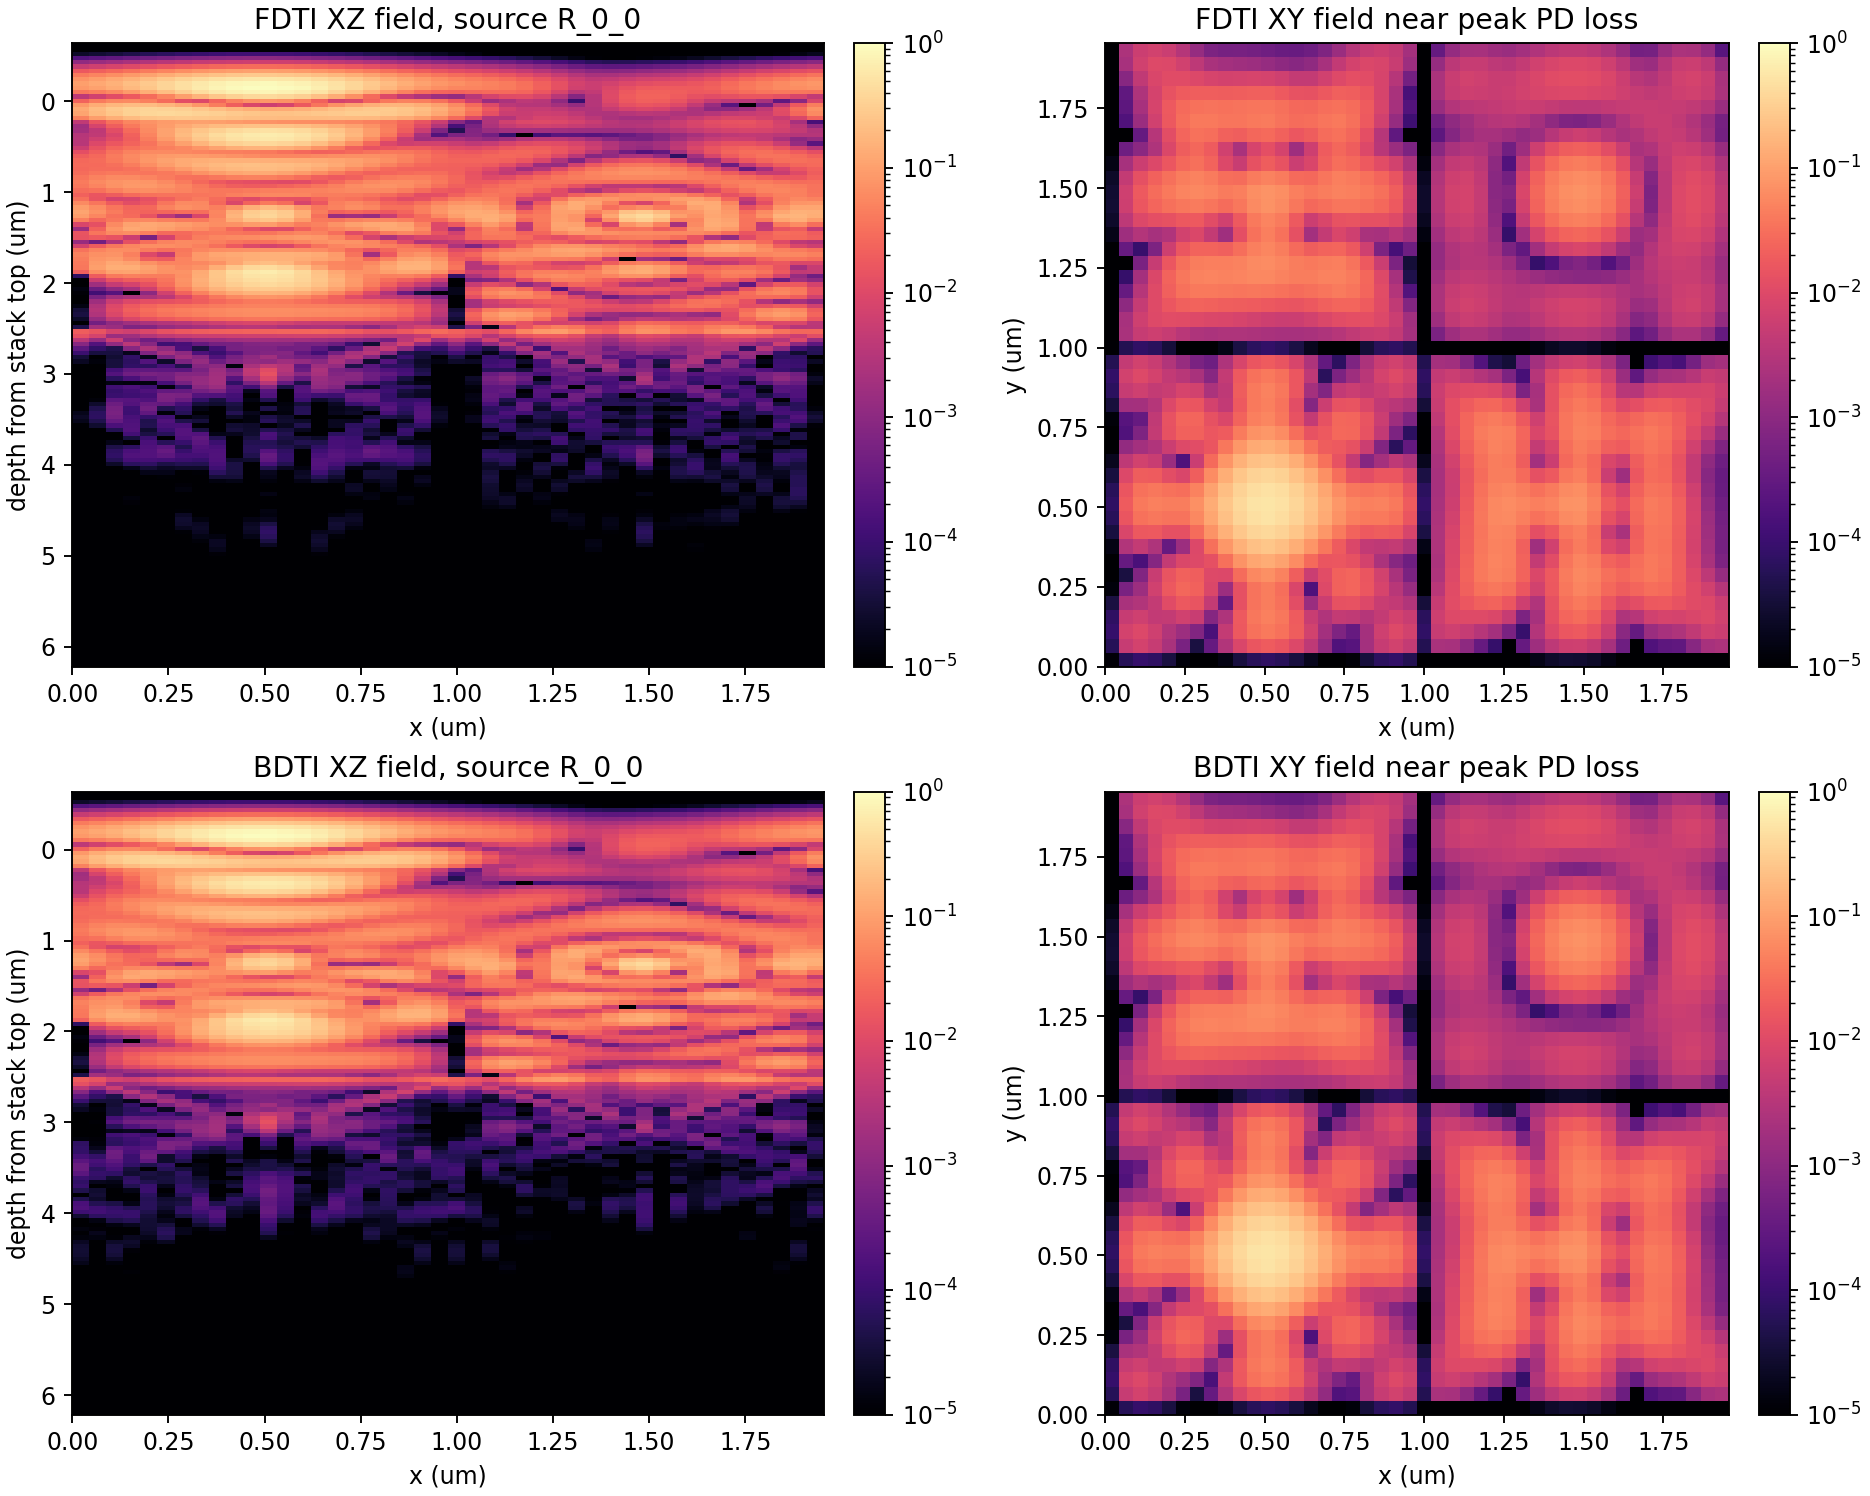
04 Fdtd Field Slices
2x2 pixel scalar FDTD, 64x64x170, 3500 steps
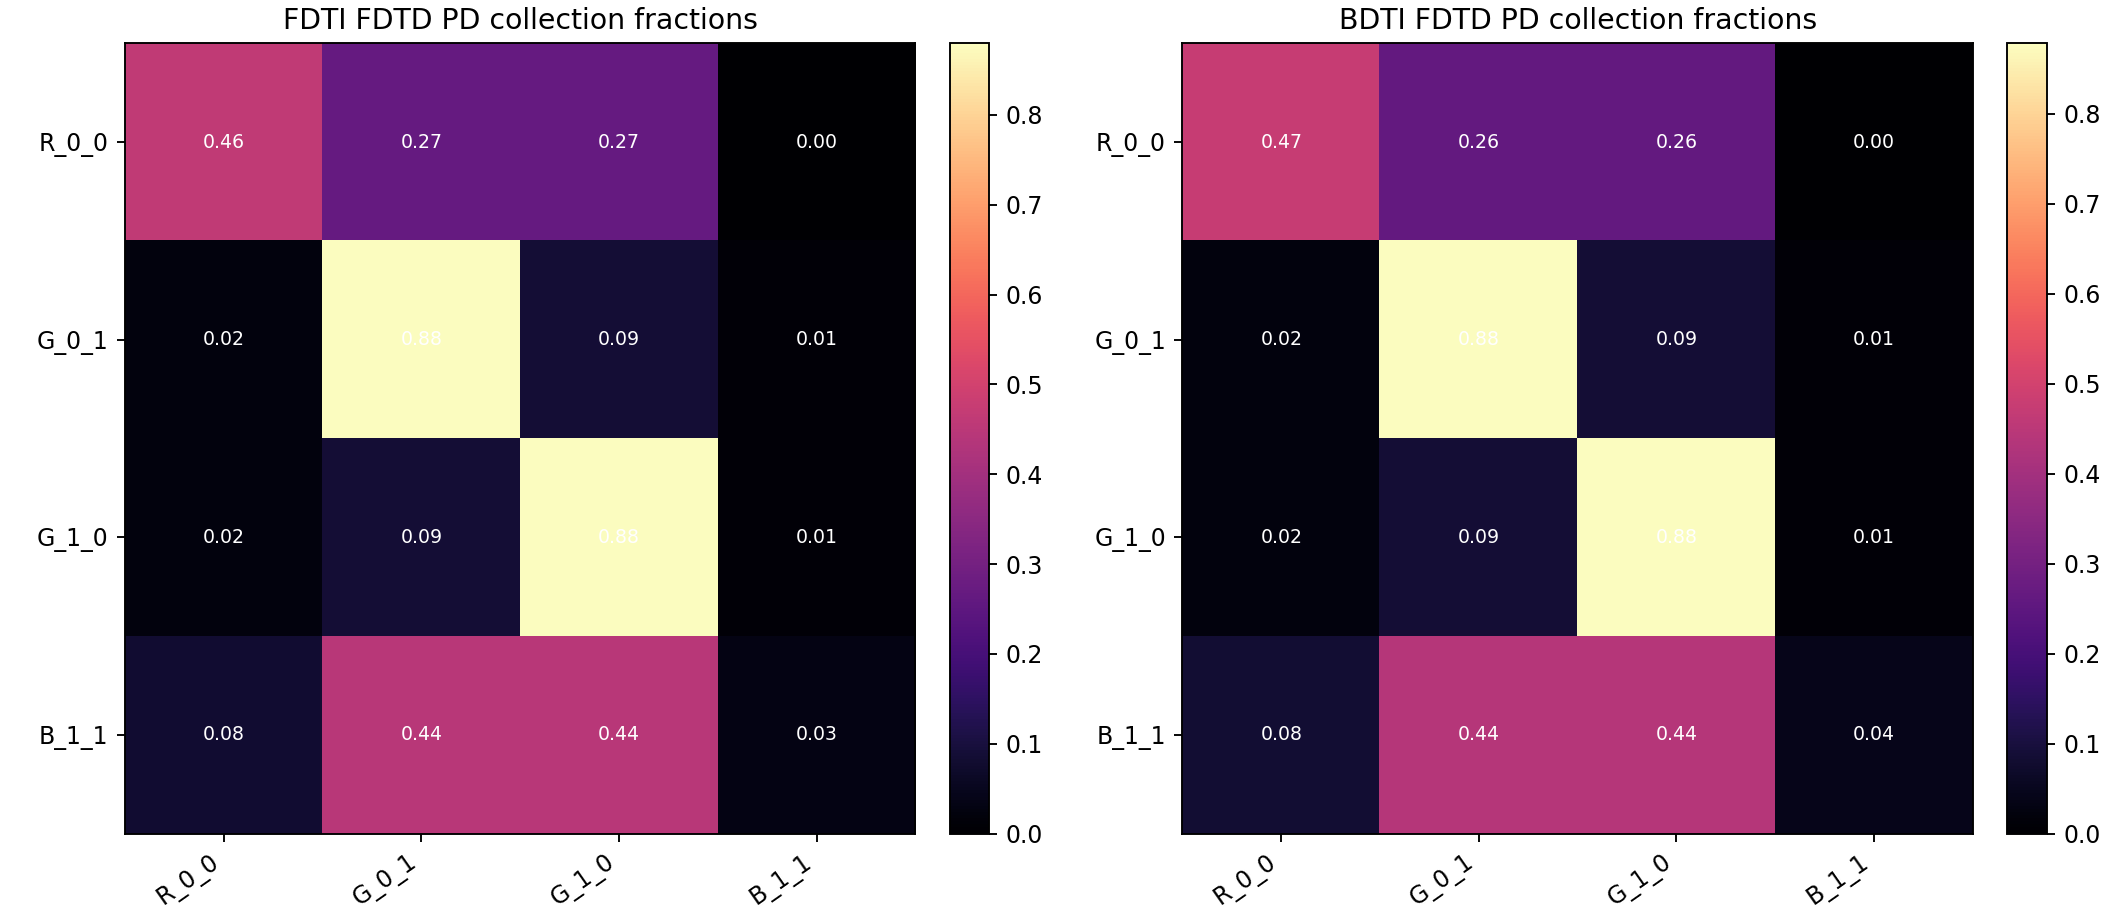
03 Fdtd Crosstalk Matrix
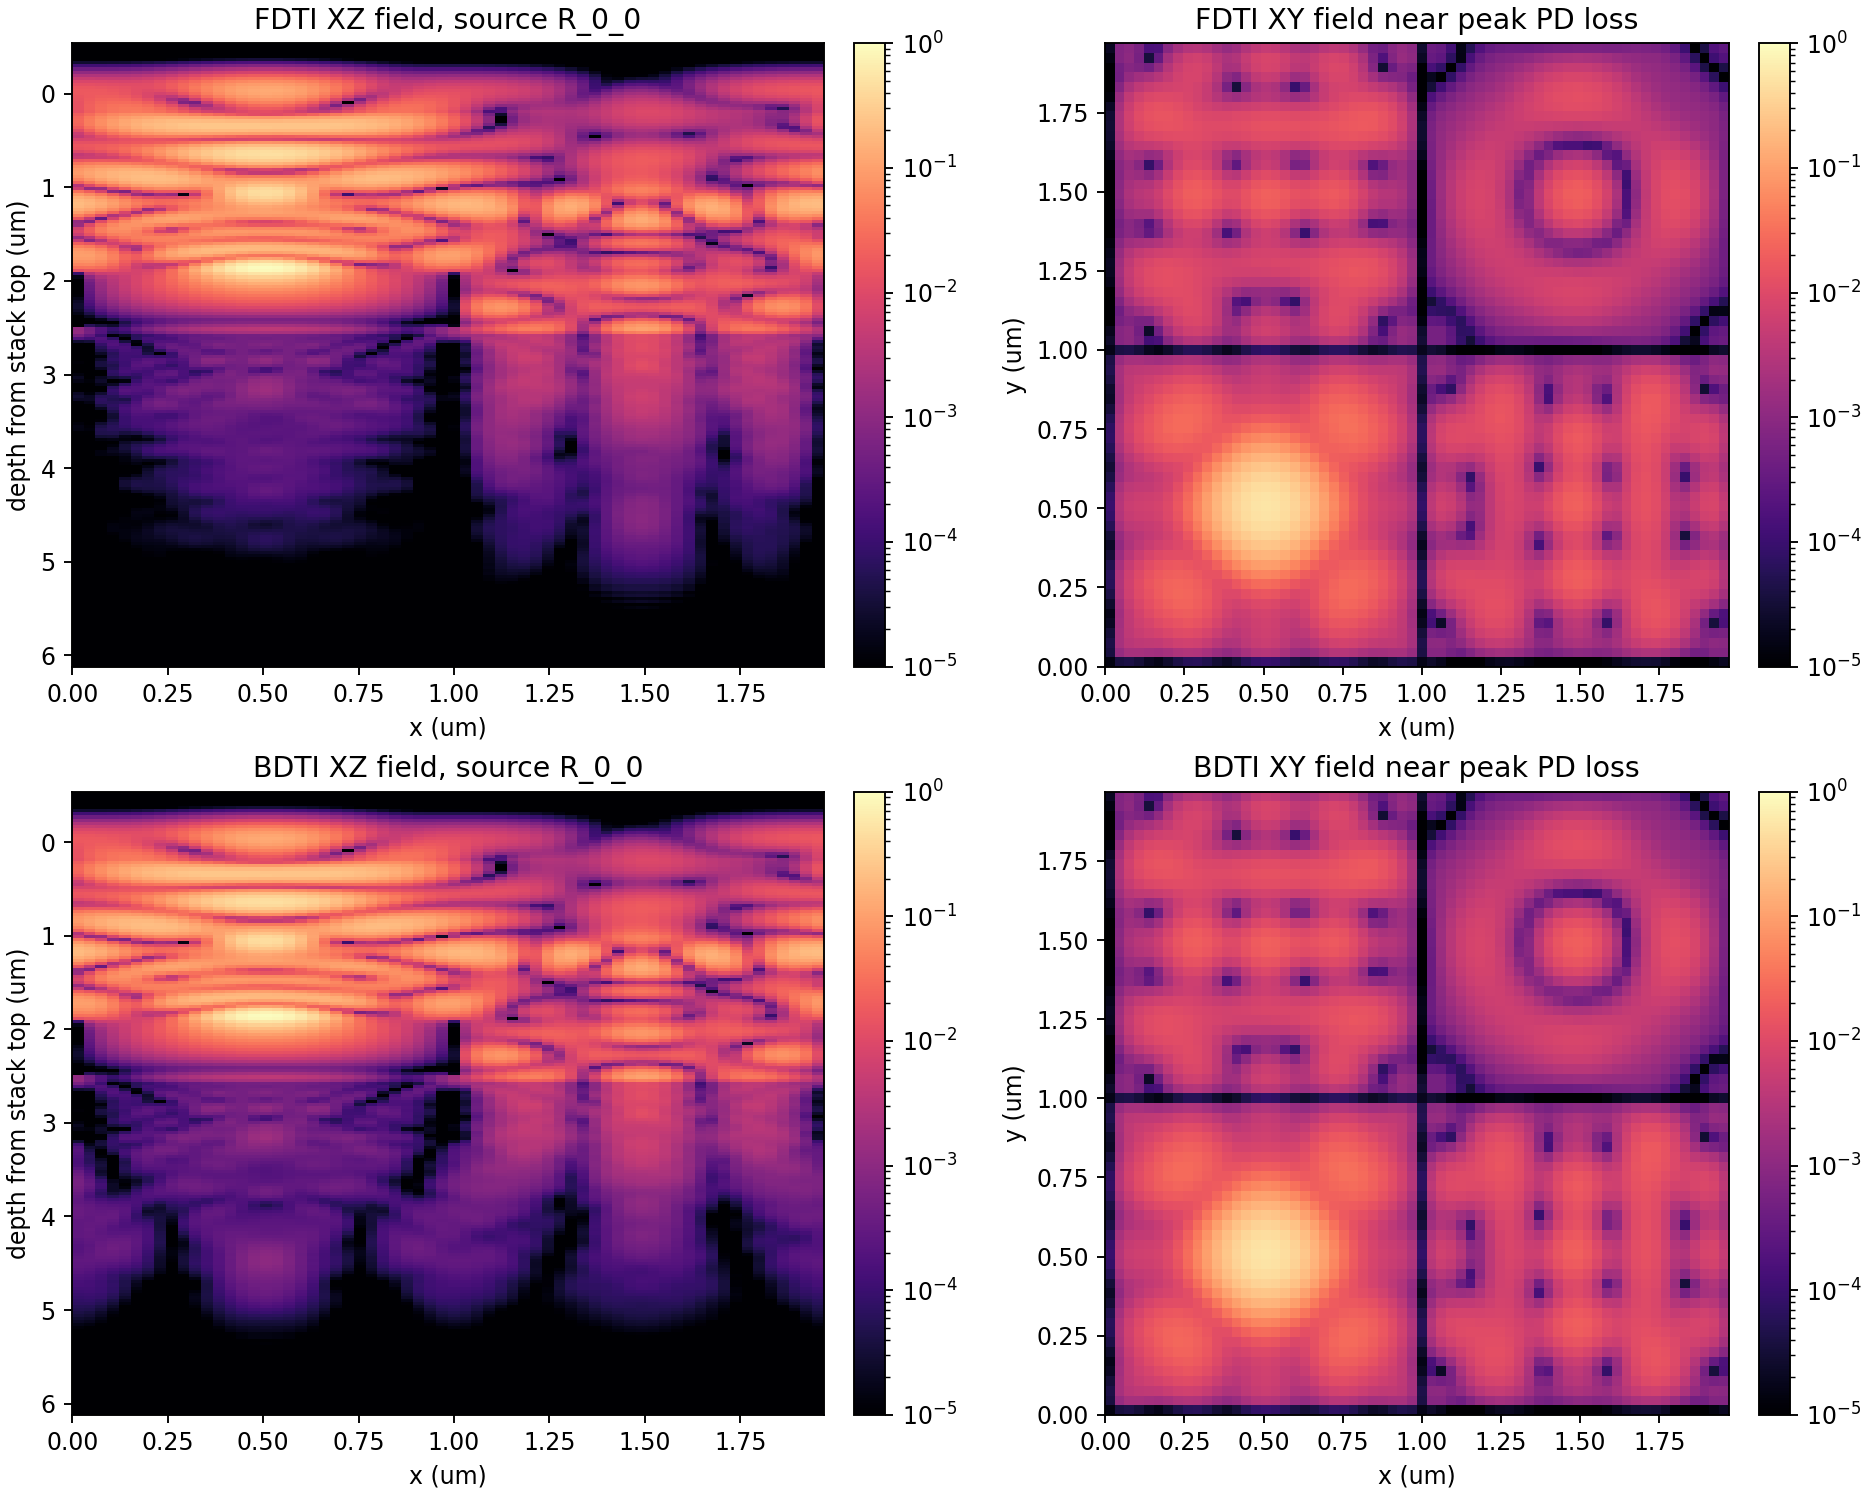
04 Fdtd Field Slices
2x2 pixel scalar FDTD, 64x64x170, 5200 steps
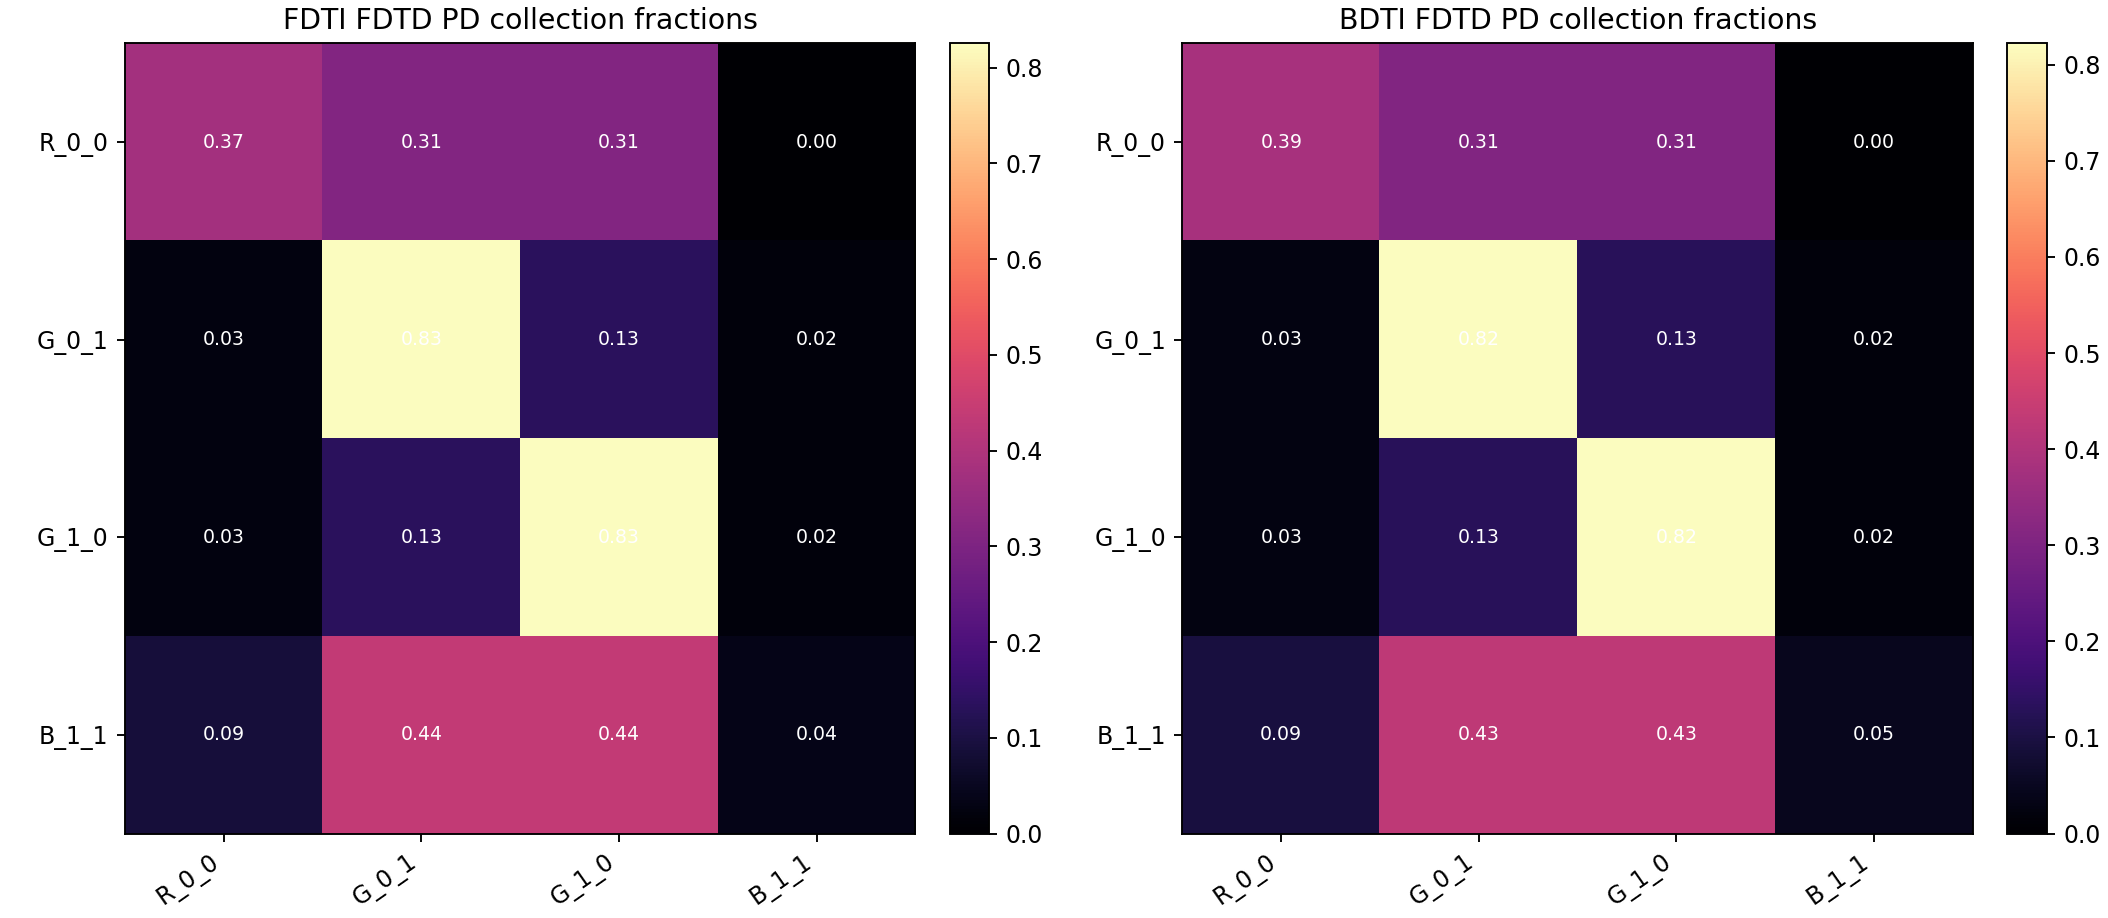
03 Fdtd Crosstalk Matrix
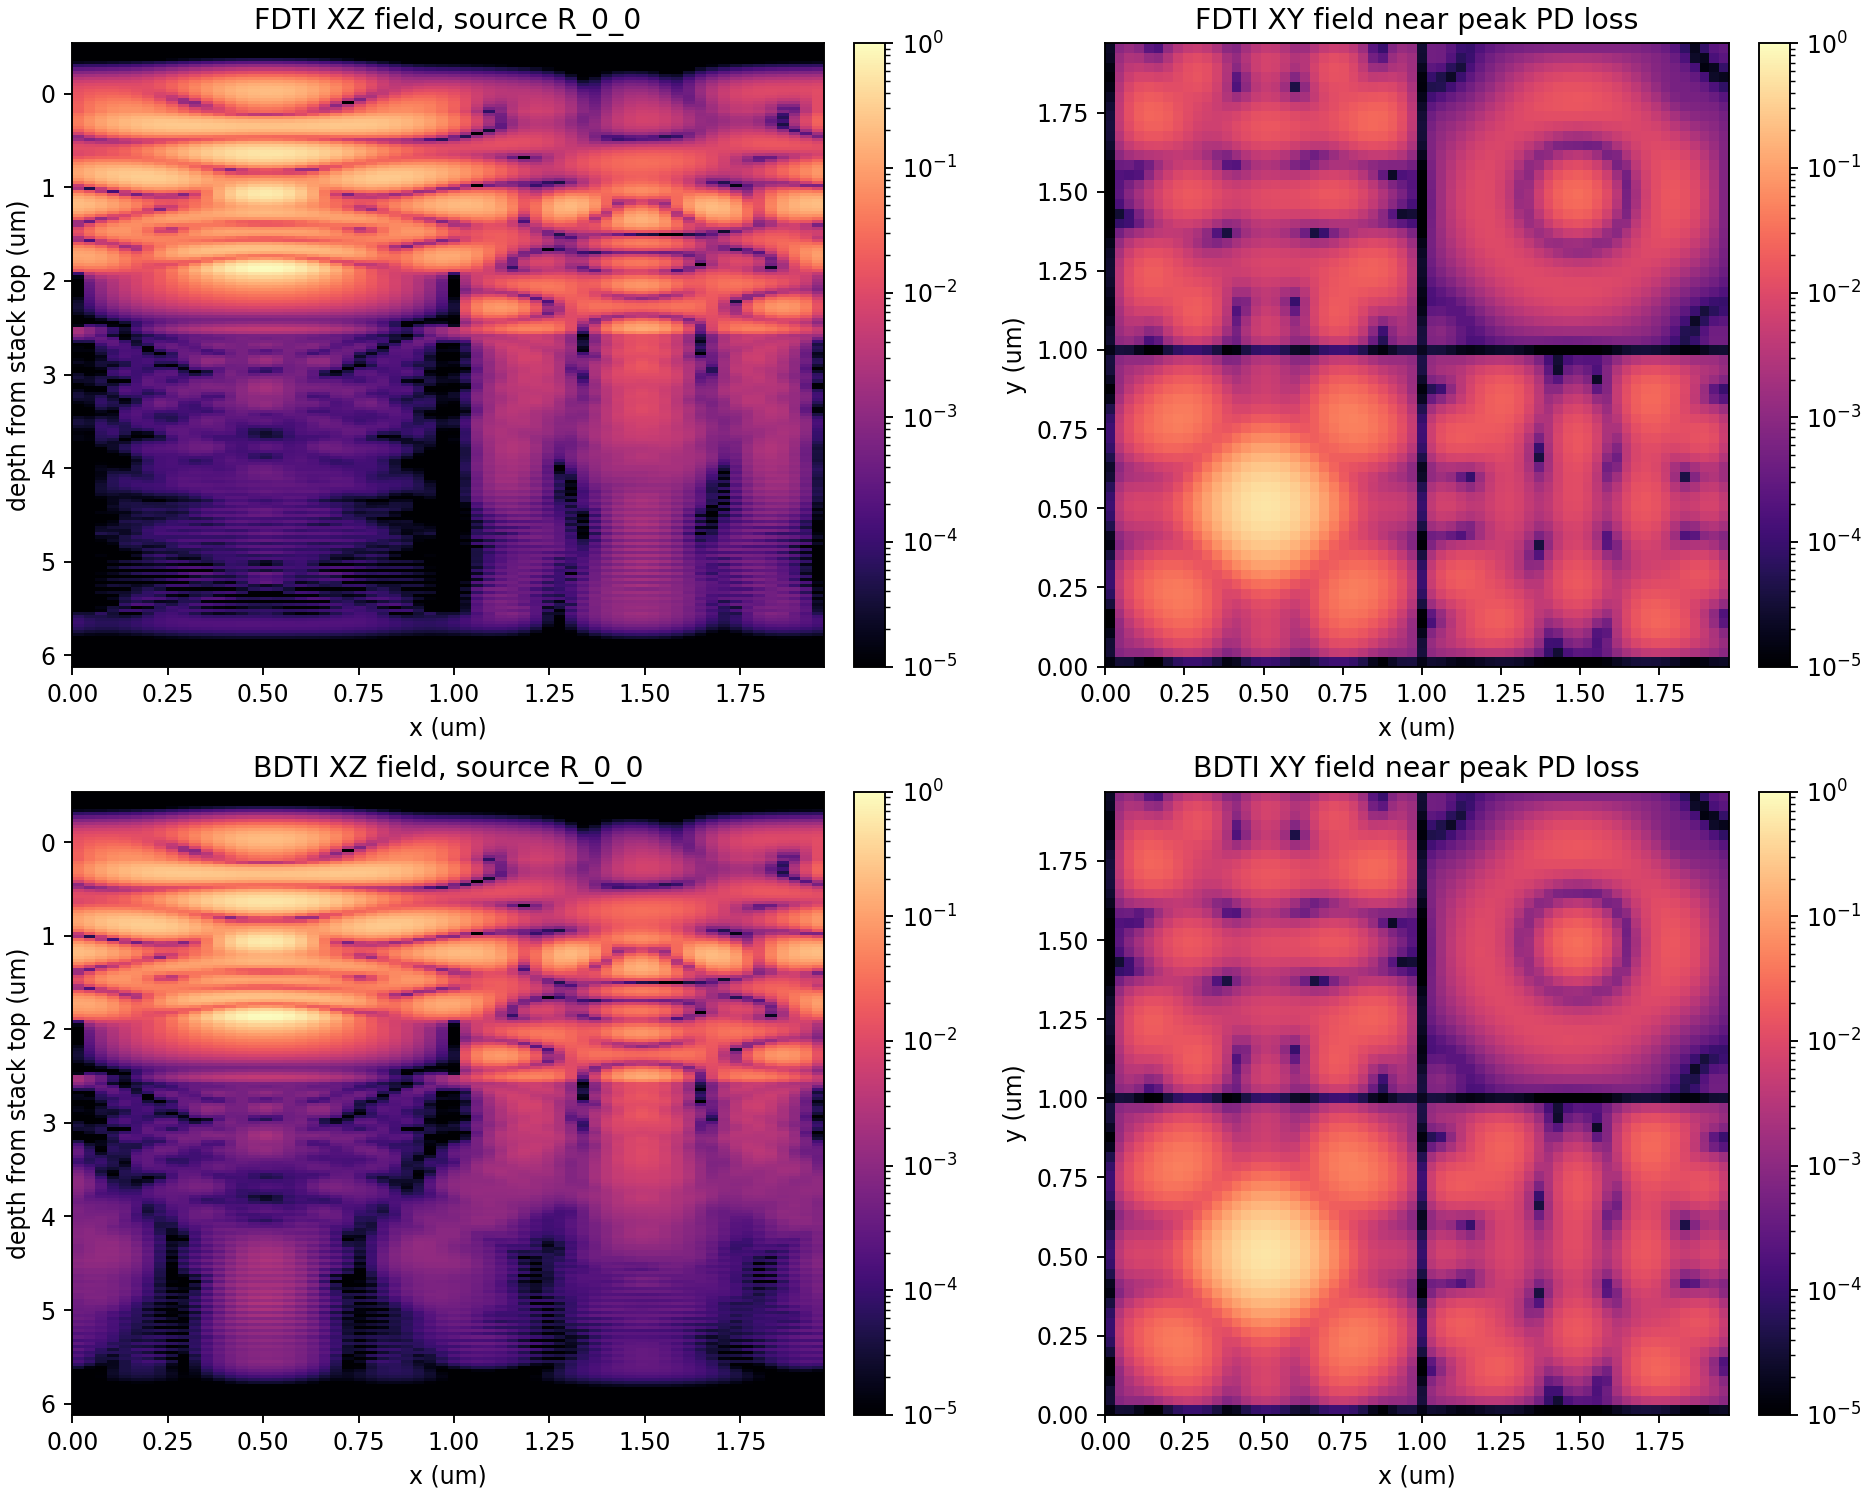
04 Fdtd Field Slices
2x2 pixel scalar FDTD, 128x128x340, single source, 10400 steps
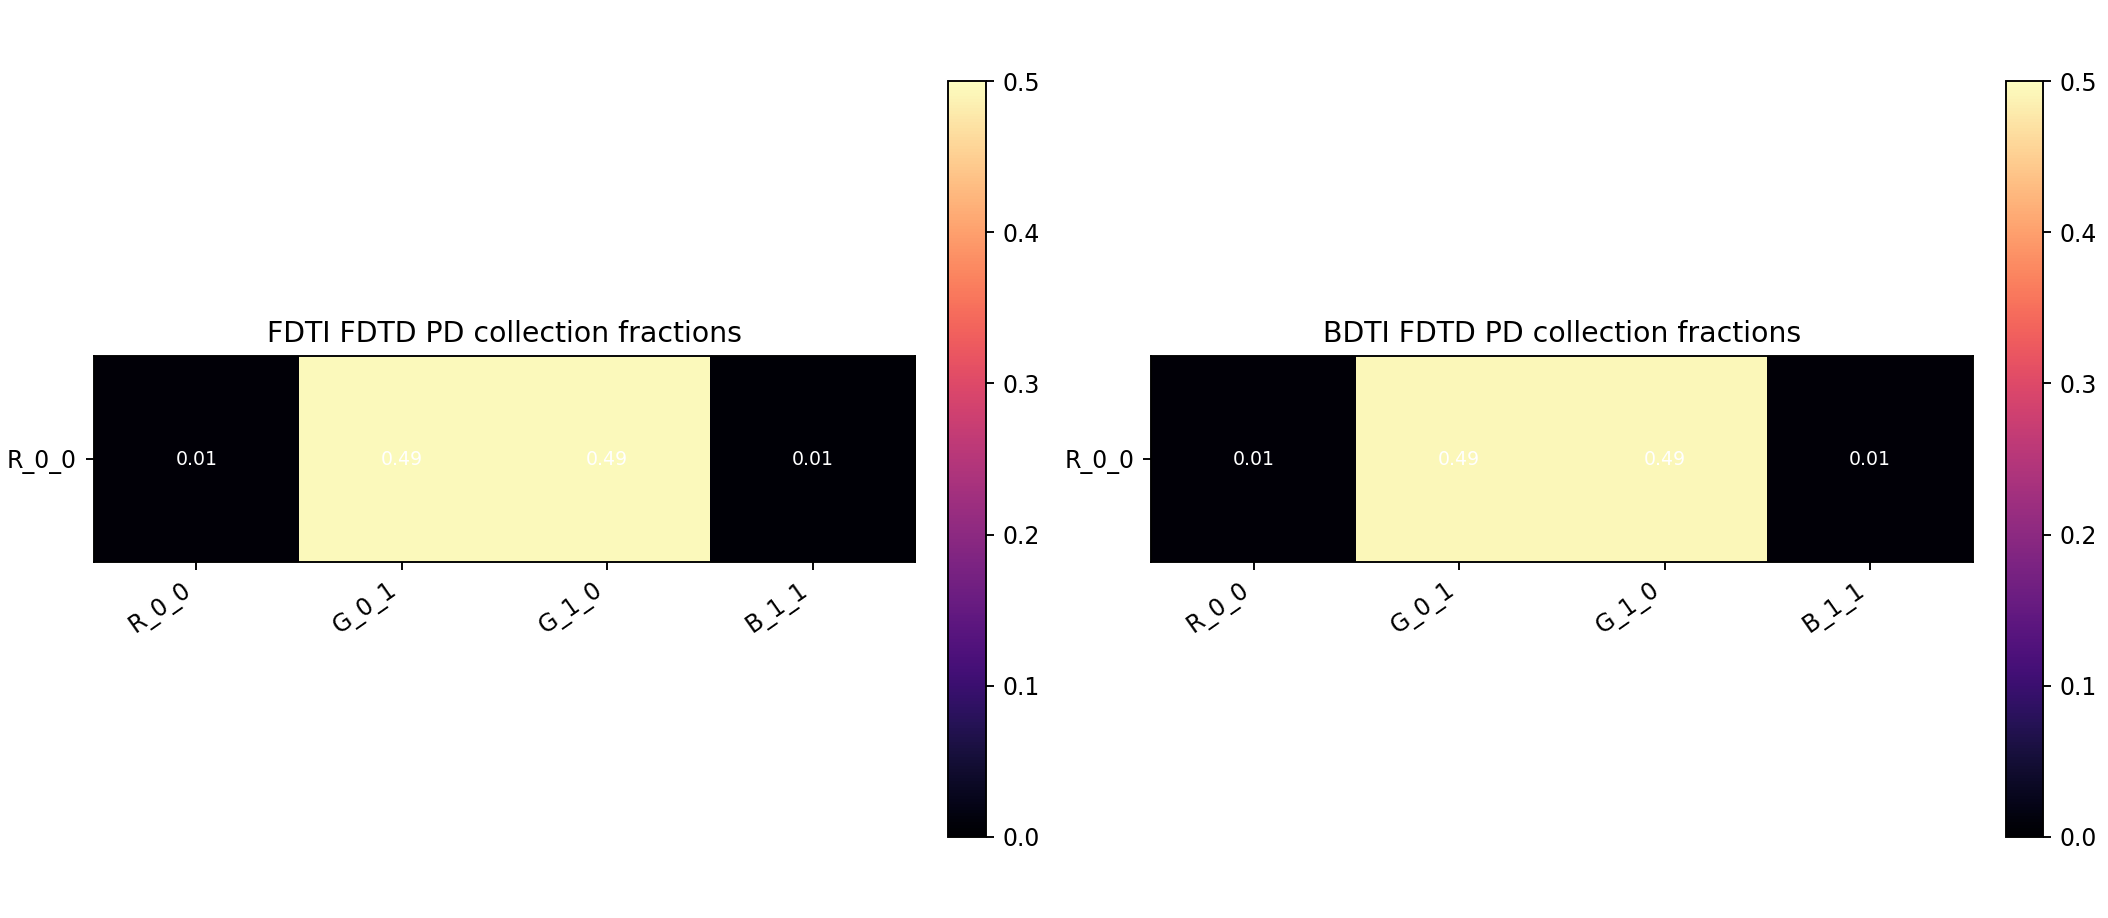
03 Fdtd Crosstalk Matrix
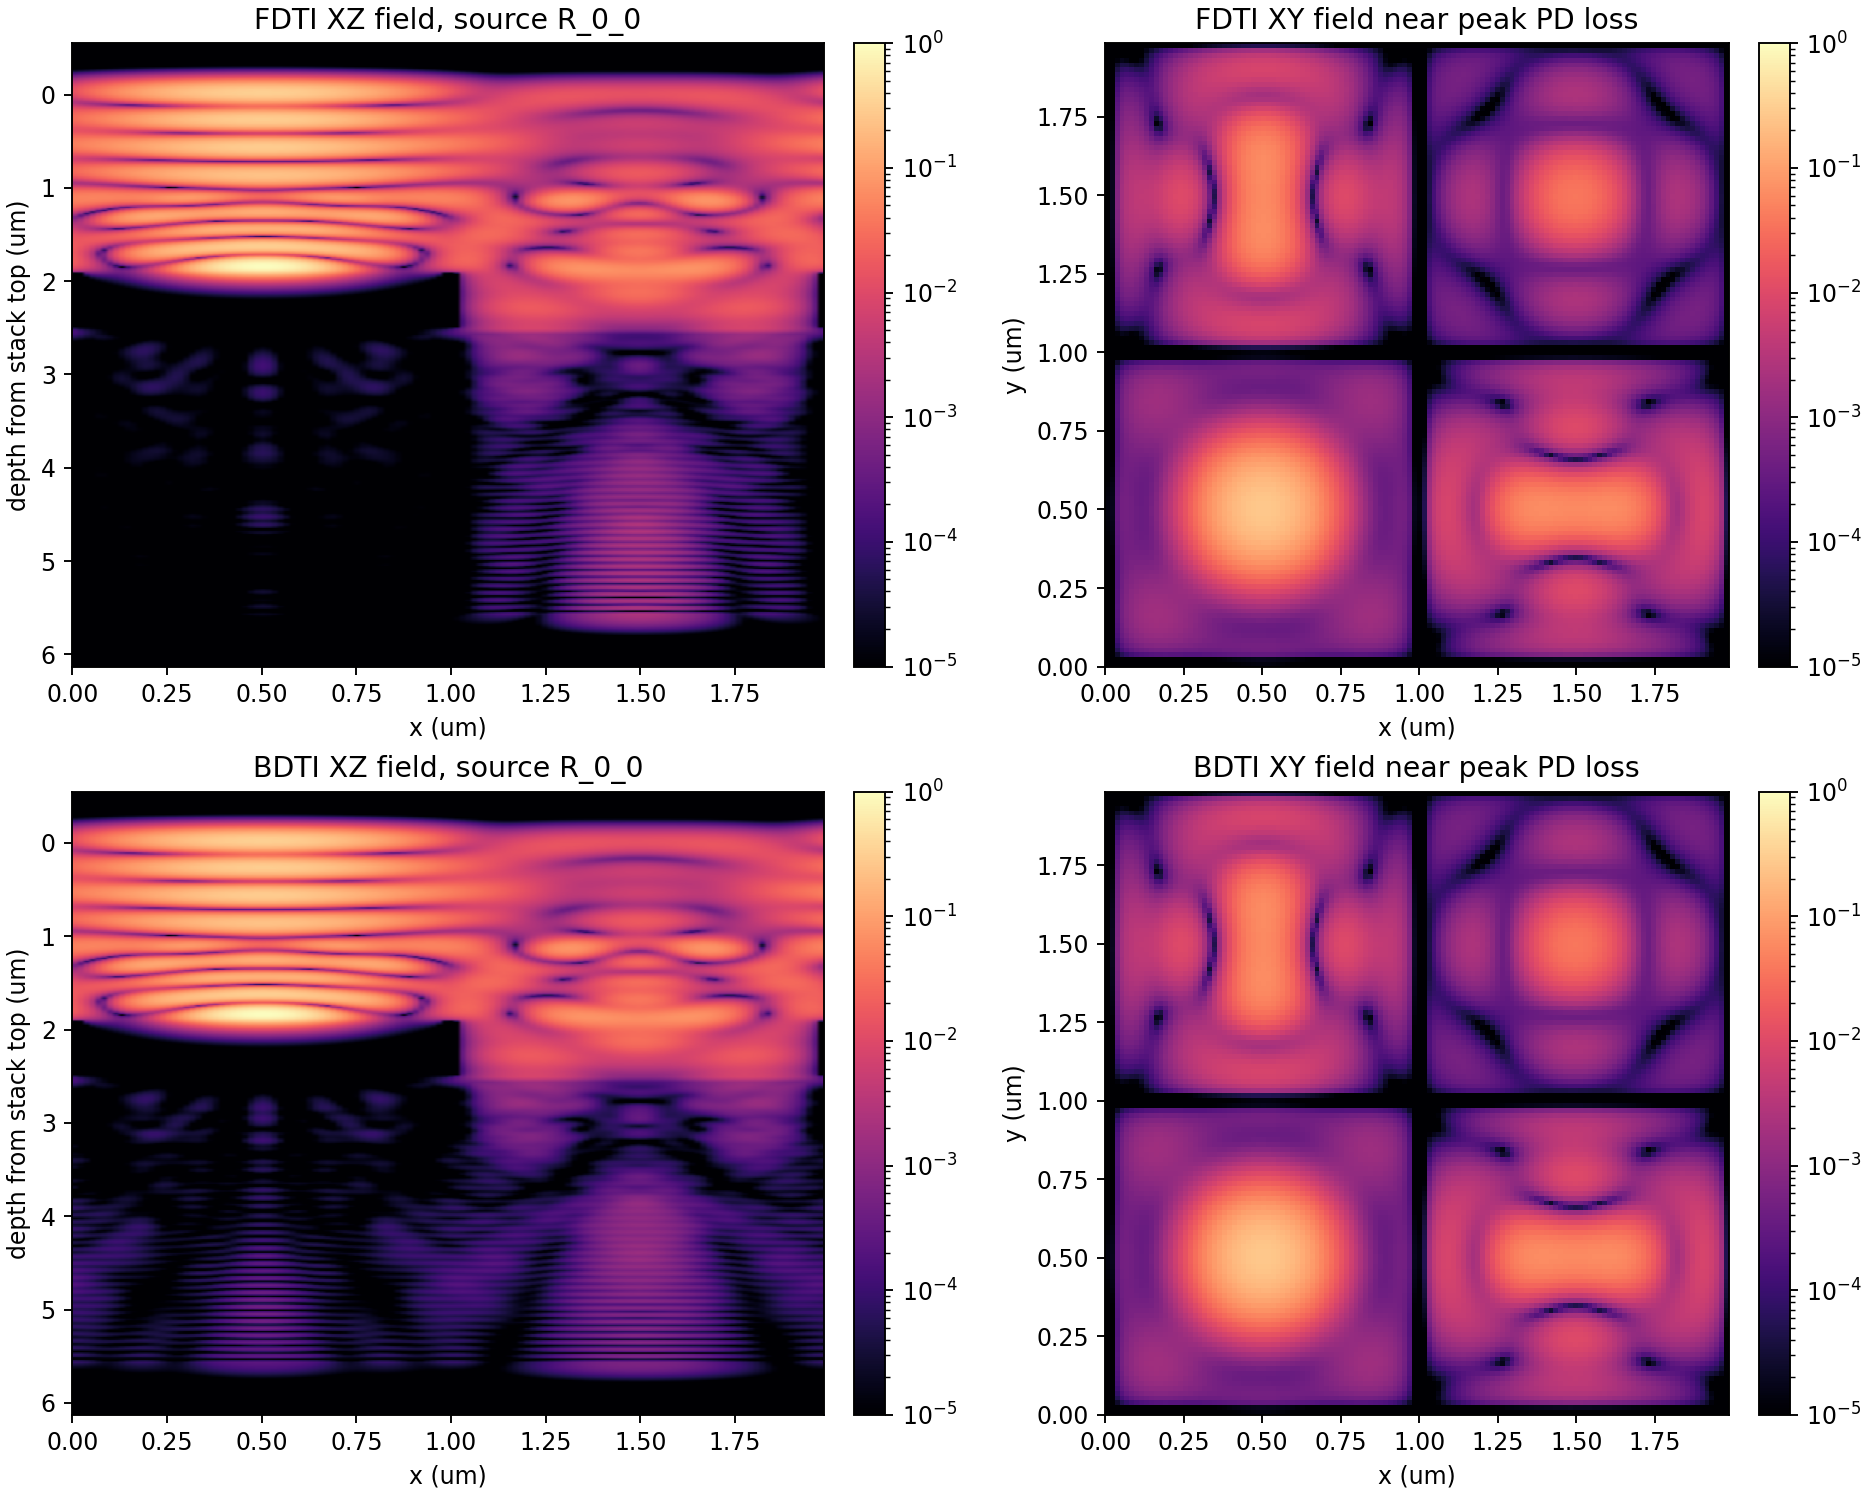
04 Fdtd Field Slices
시각적 smoke test
이 그림들은 엄밀한 solver evidence가 아니다. FDTI/BDTI geometry, photodiode window, plotting pipeline을 빠르게 눈으로 확인하기 위한 테스트로 유지한다.
Visual CMOS pixel smoke test
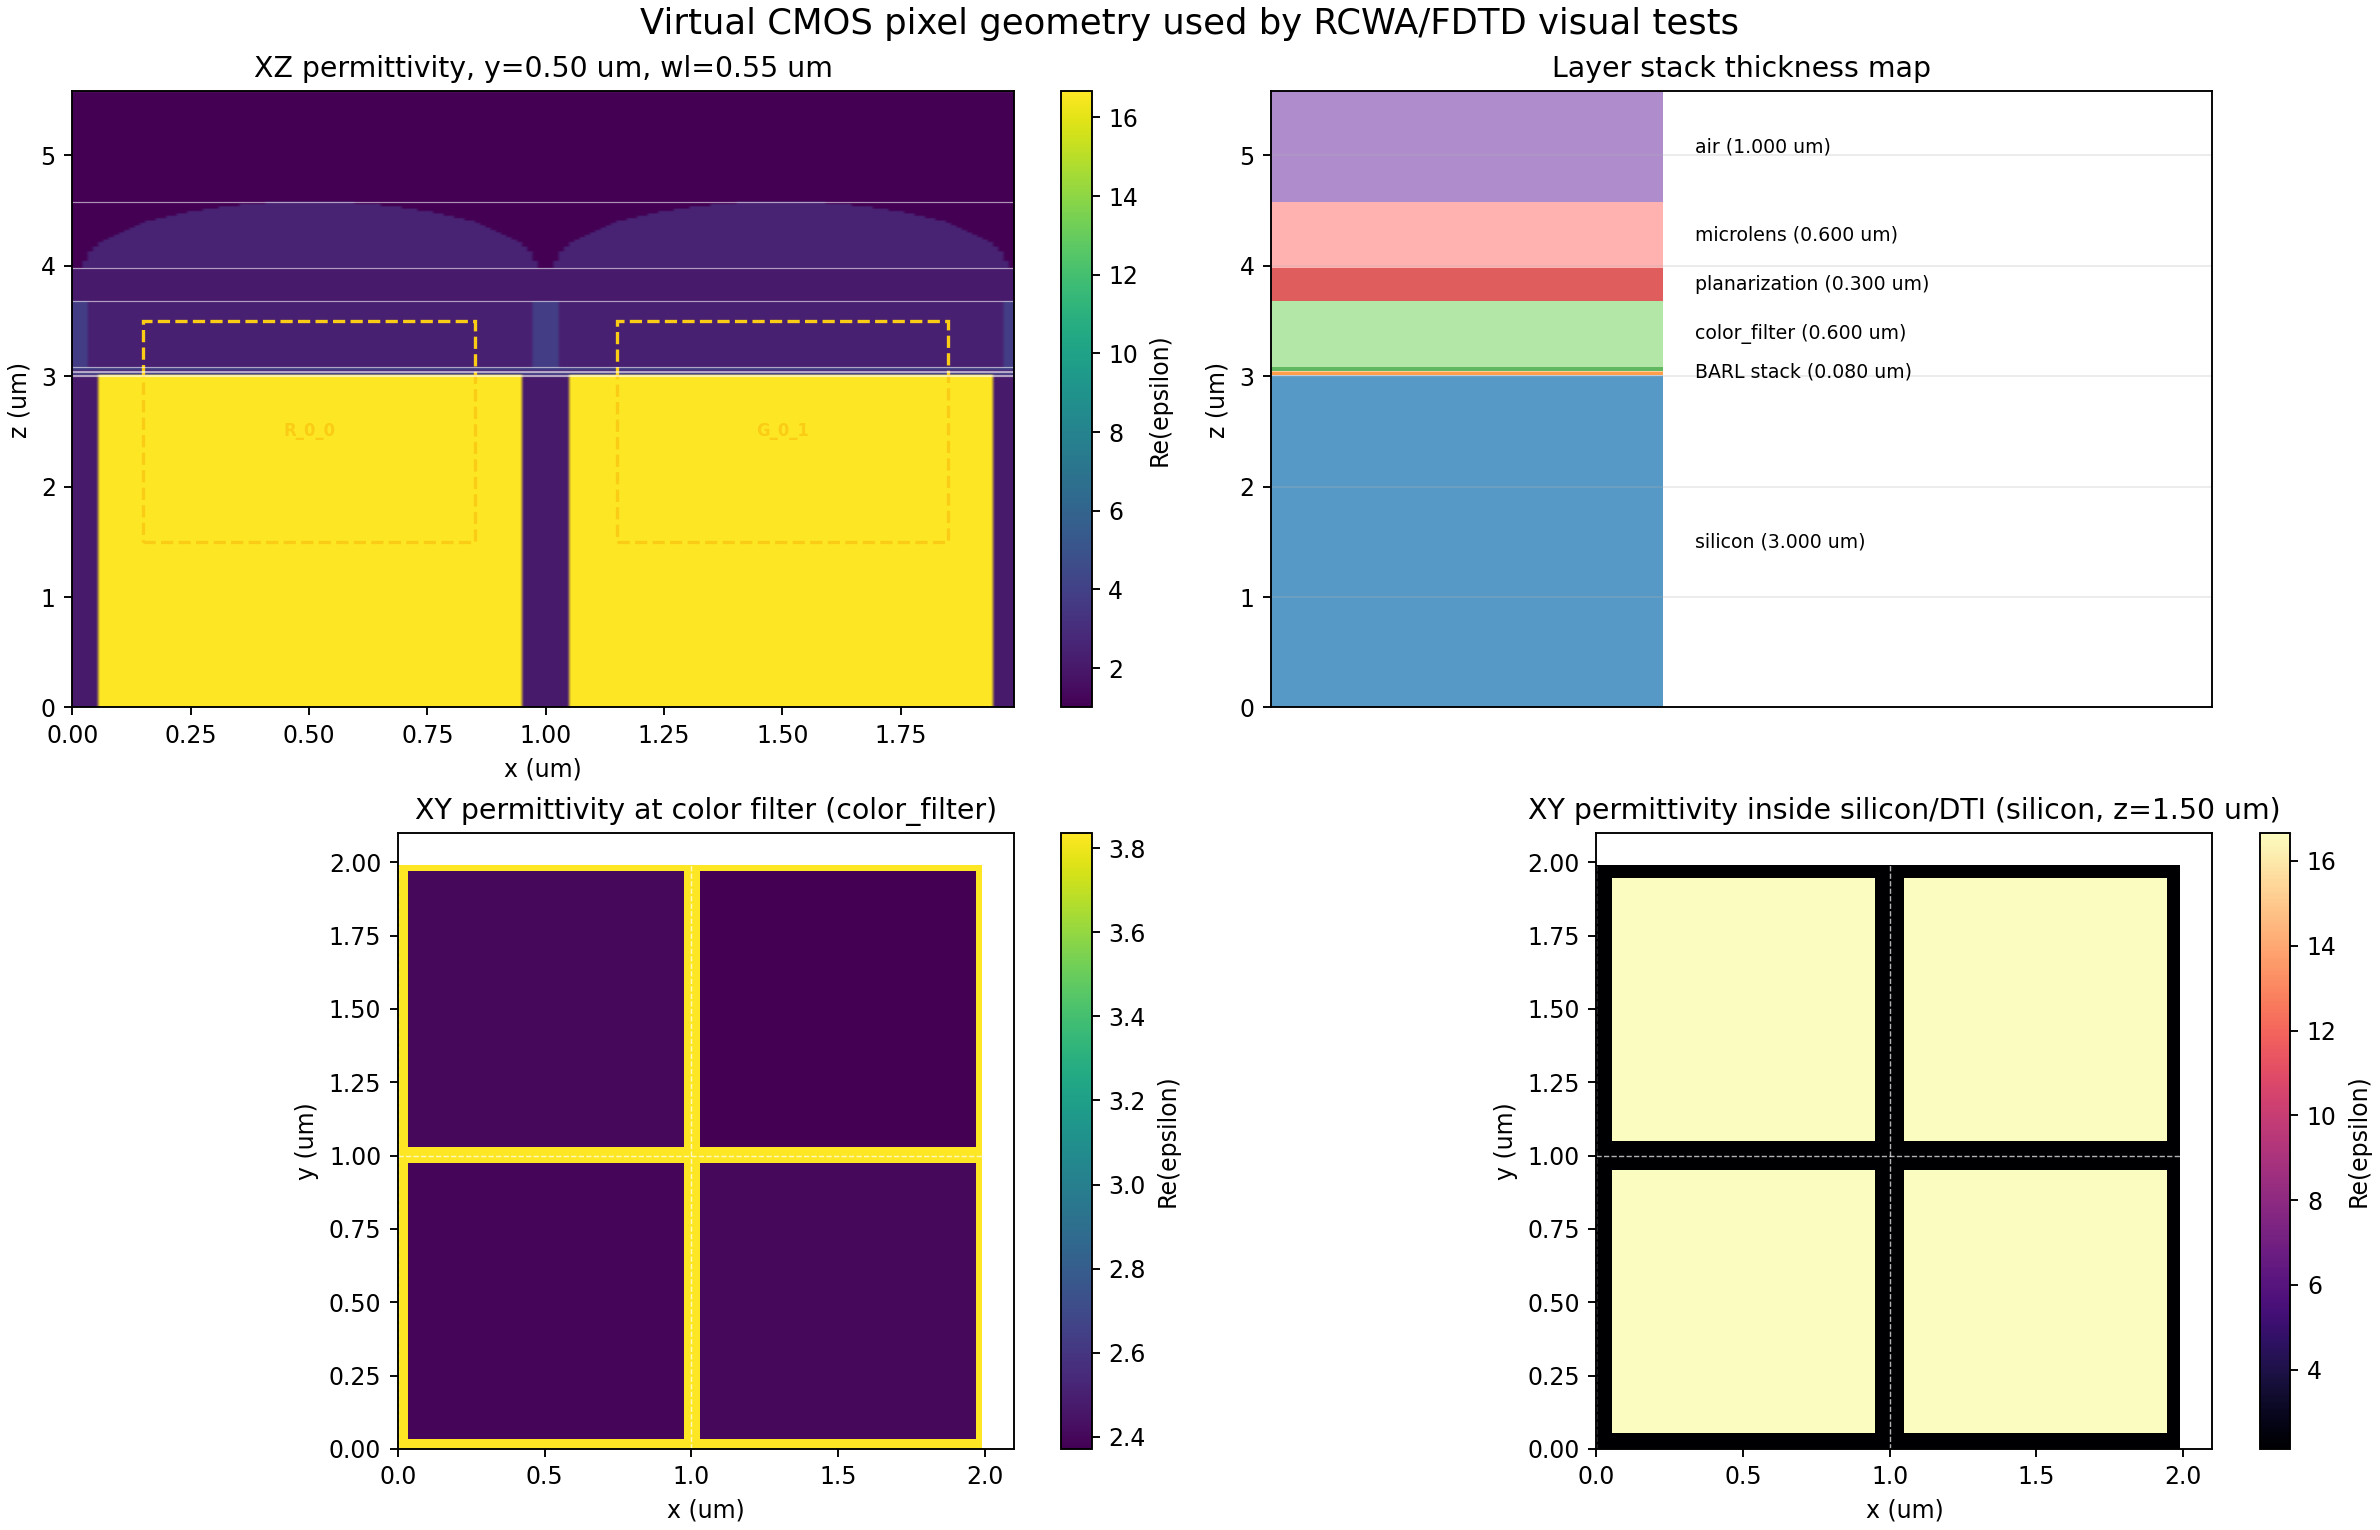
01 Geometry Overview
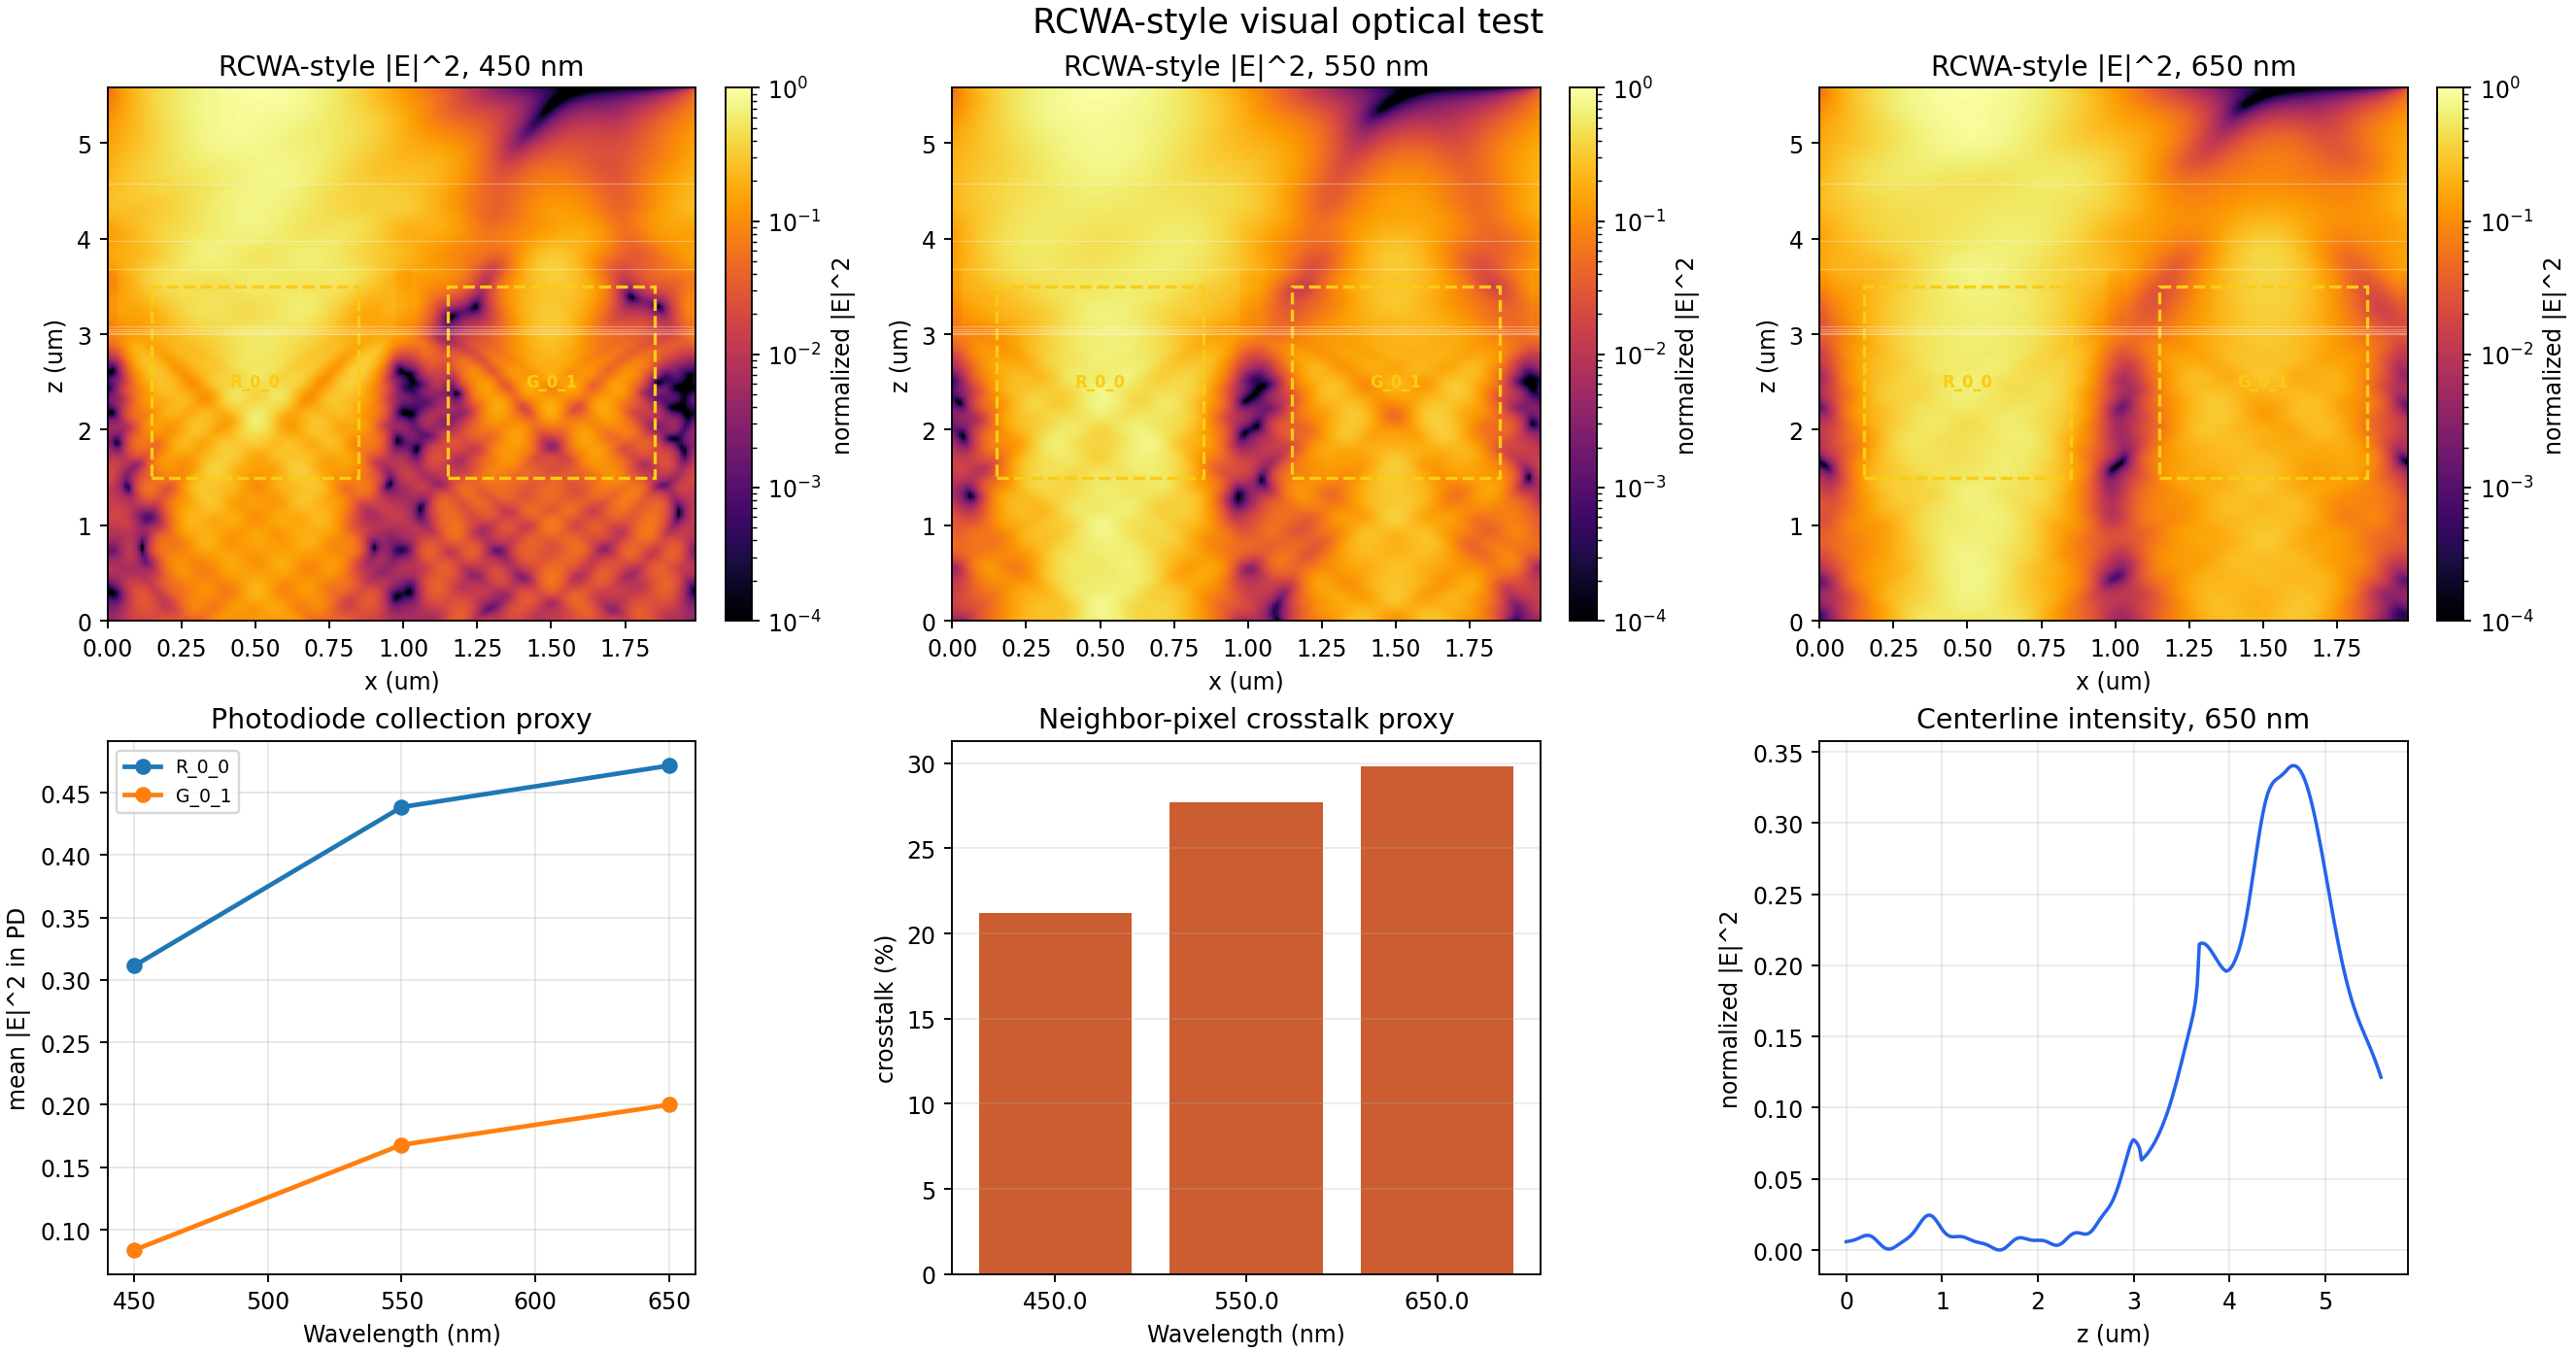
02 Rcwa Visual Test
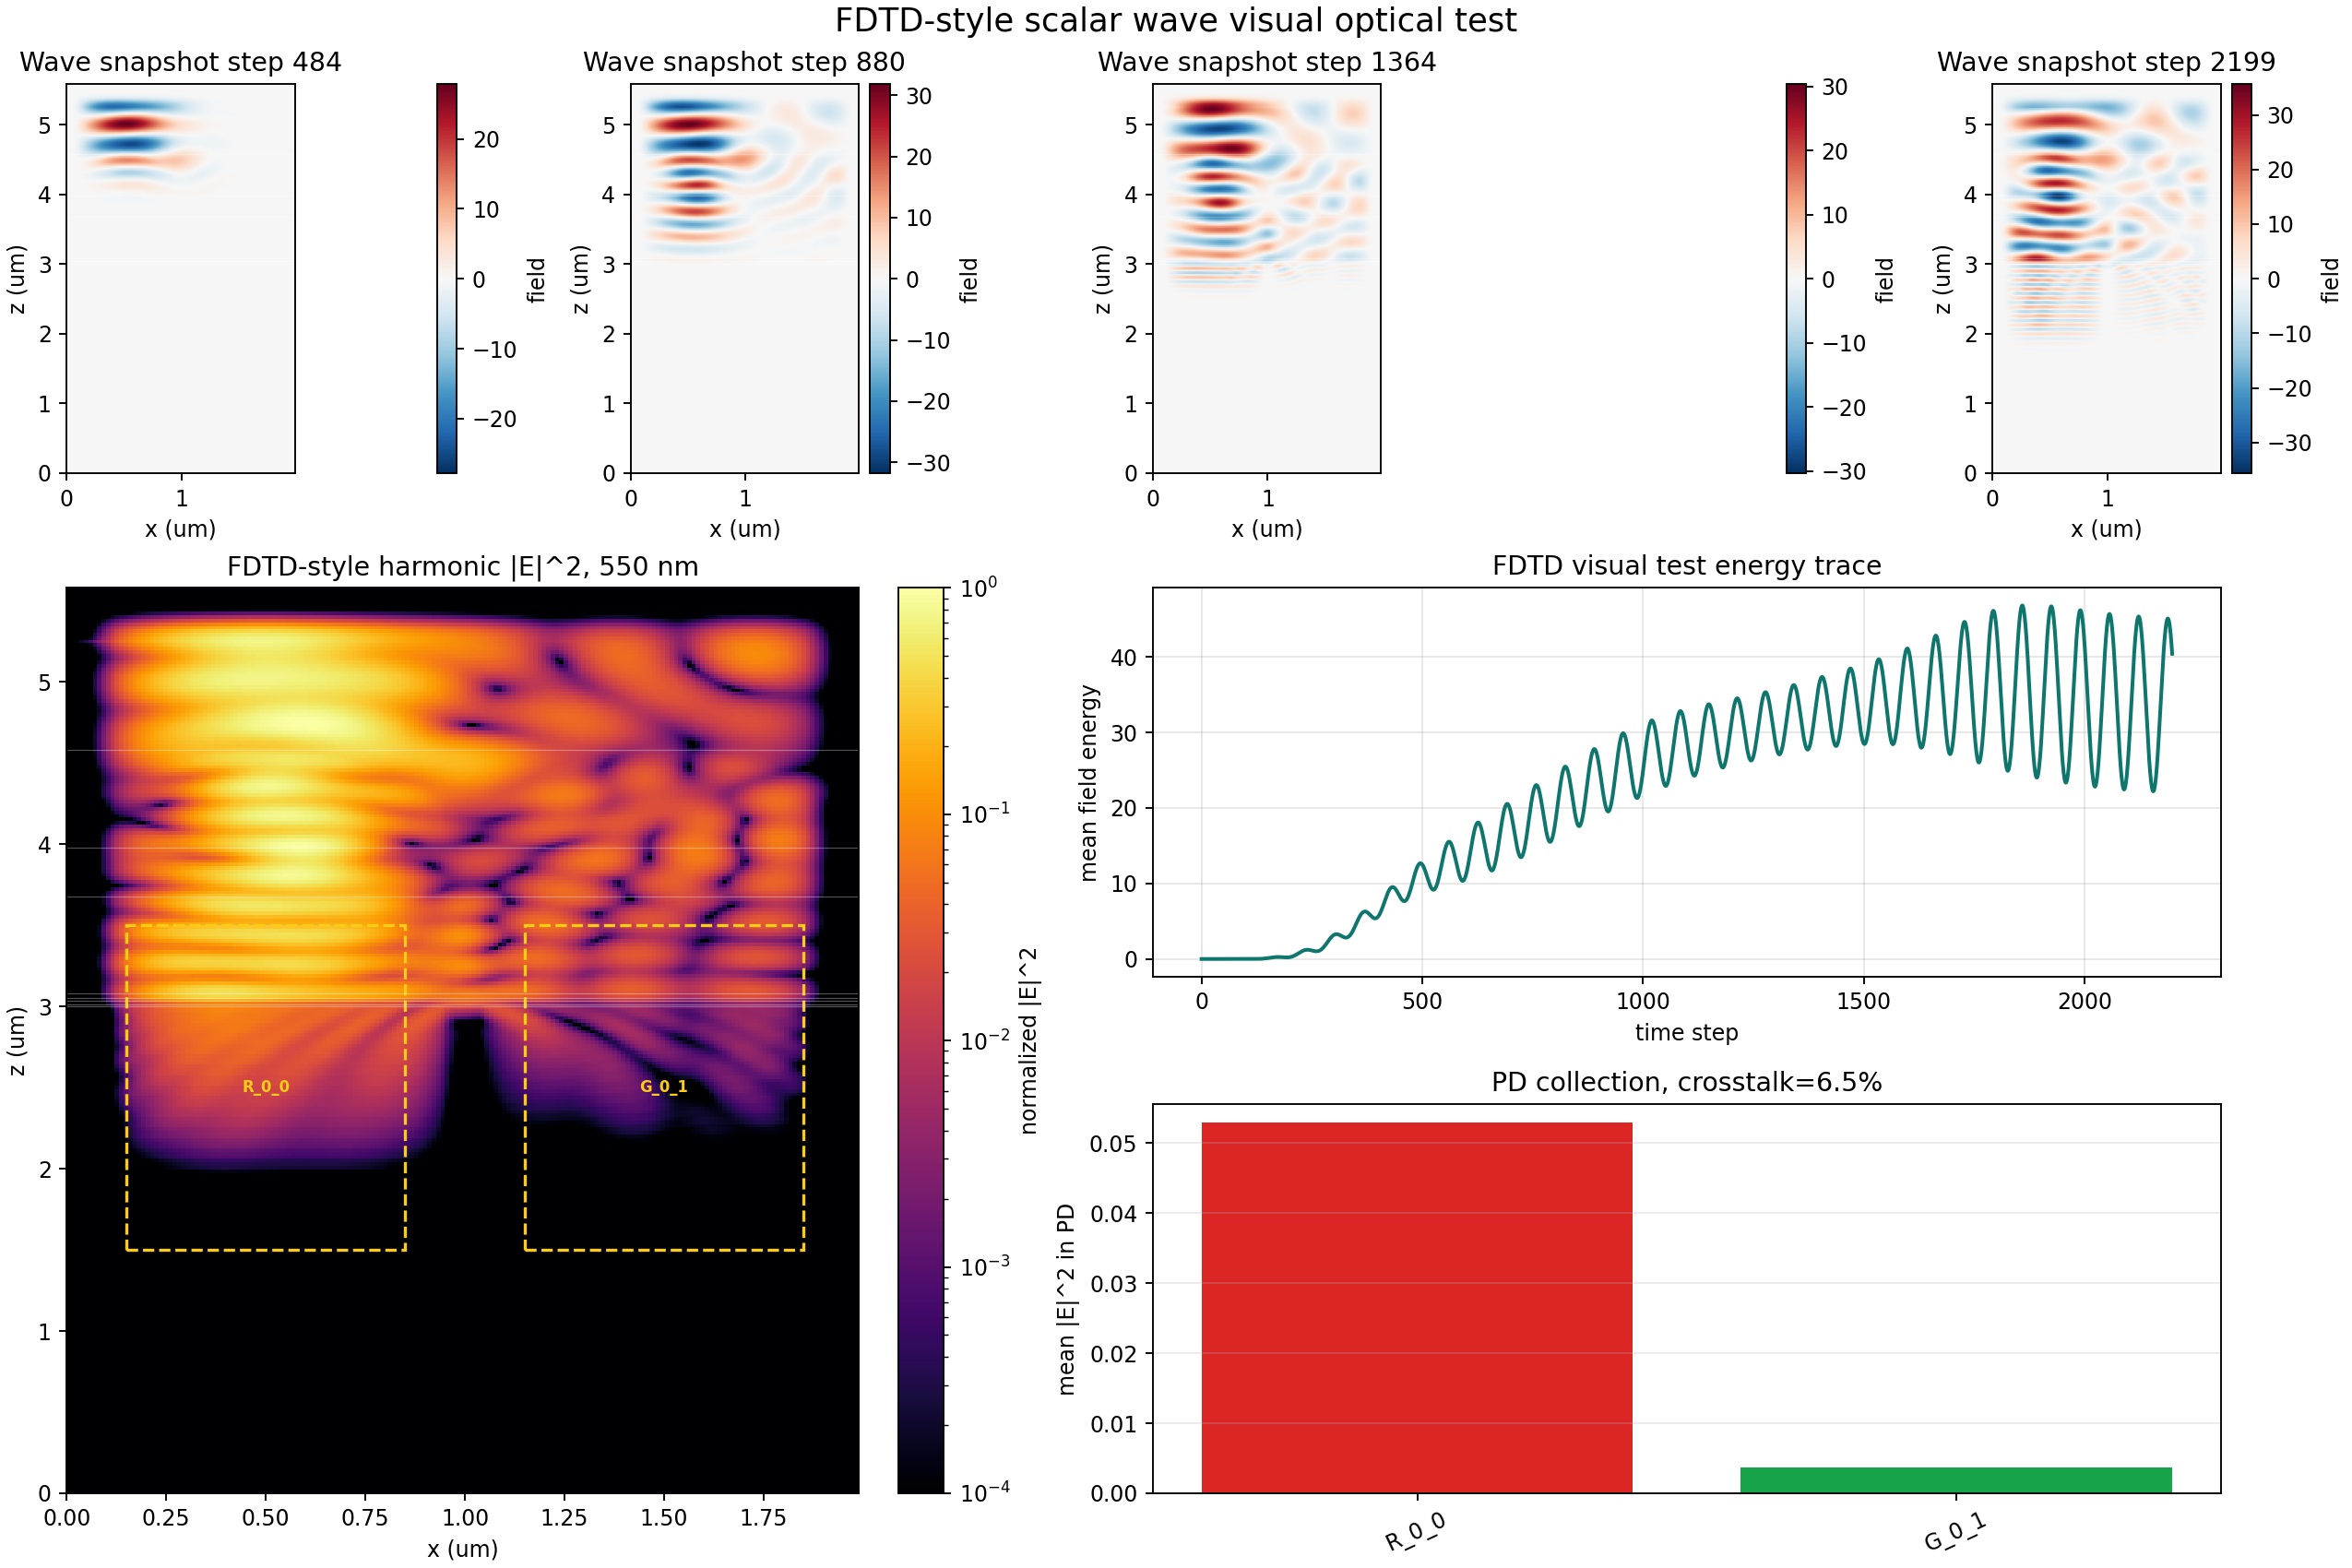
03 Fdtd Visual Test
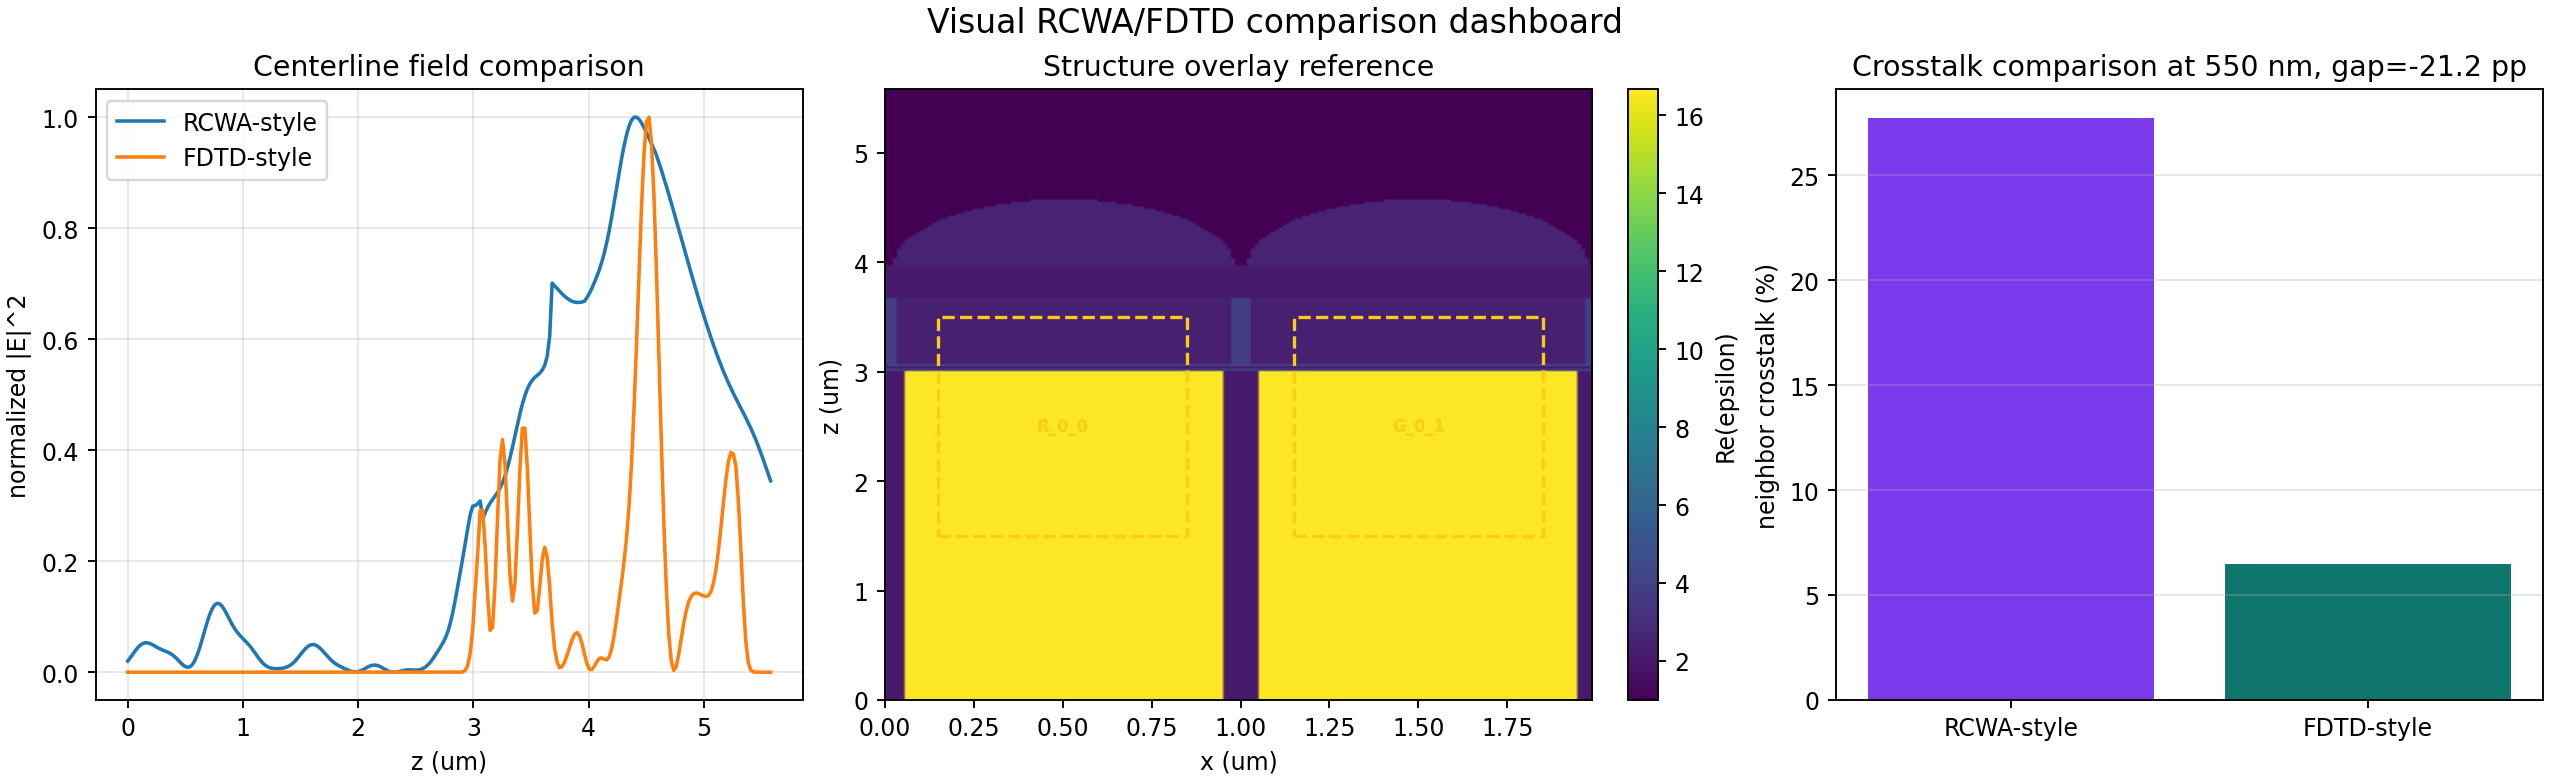
04 Rcwa Fdtd Comparison
이 리포트를 어떻게 쓸 것인가
사용자 관점
- FDTI/BDTI 동작의 현재 안정적 시각 비교 기준은 44x44x118, 3500-step pixel 행이다.
- 64x64x170 및 128x128x340 행은 아직 물리 시간이 짧으므로 최종 성능 주장이 아니라 진단 근거로 해석한다.
- 일반적인 파라미터 선택은 convergence-study cookbook을 우선 보고, 그 판단의 근거가 필요할 때 이 리포트를 사용한다.
유지보수자 관점
- 전체 pixel을 보기 전에 1D 사다리로 normalization, material loss, monitor 계산을 먼저 검증한다.
- FDTI/BDTI 비교는 periodic trench benchmark에서 같은 geometry와 R/T/A 정의로 먼저 맞춘다.
- 최종 고정밀 평가는 FDTD step을 grid refinement에 맞춰 늘리고, 네 source를 모두 돌리며, RCWA도 Fourier order와 permittivity grid sweep을 같이 수행해야 한다.